Accenture plc's management explains the business in its own materials. The slides below do the most of that work, pulled from the documents preserved in Sources. Each source link opens the complete presentation at that slide in a new tab.
The most recent deck, and the one where management lays out the cybersecurity platform build and the new mid-market business. · Open the full document →
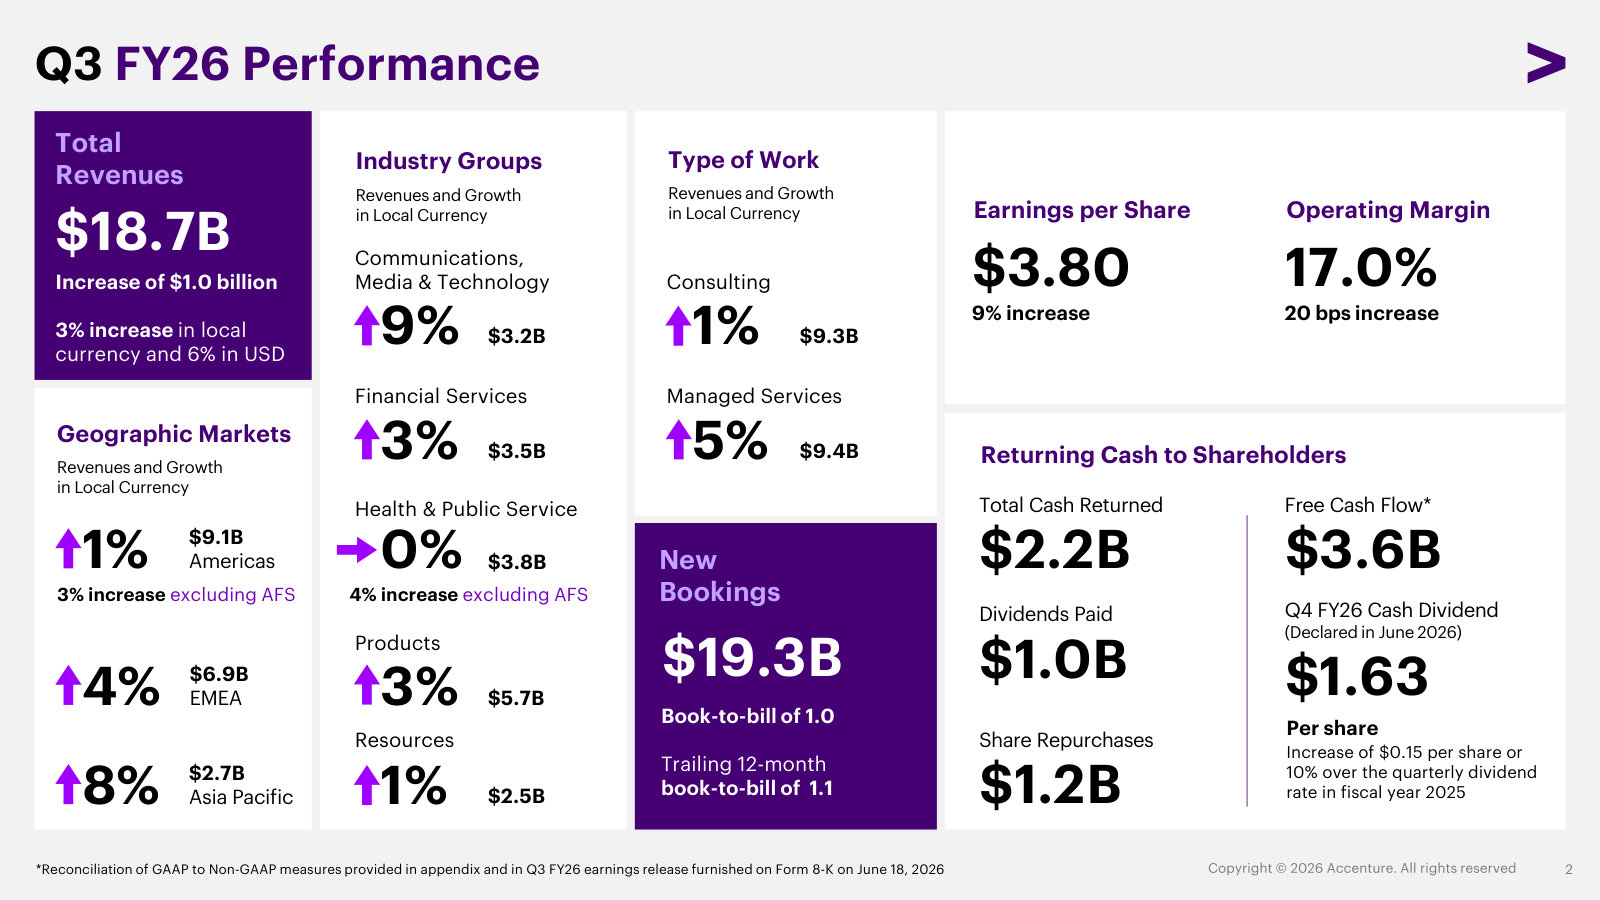
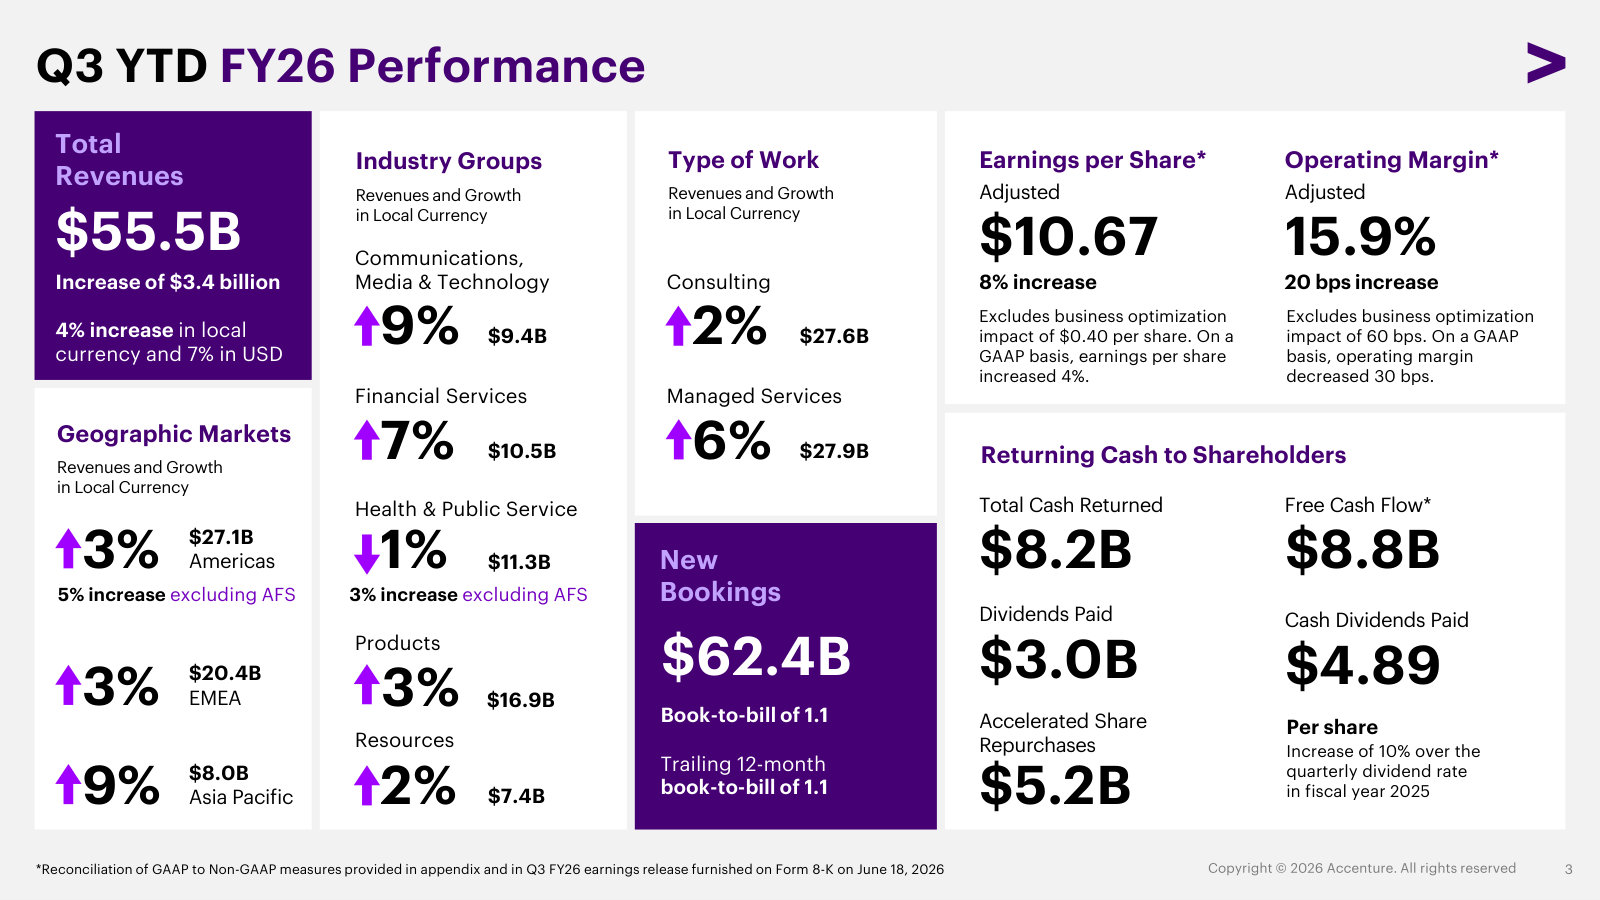
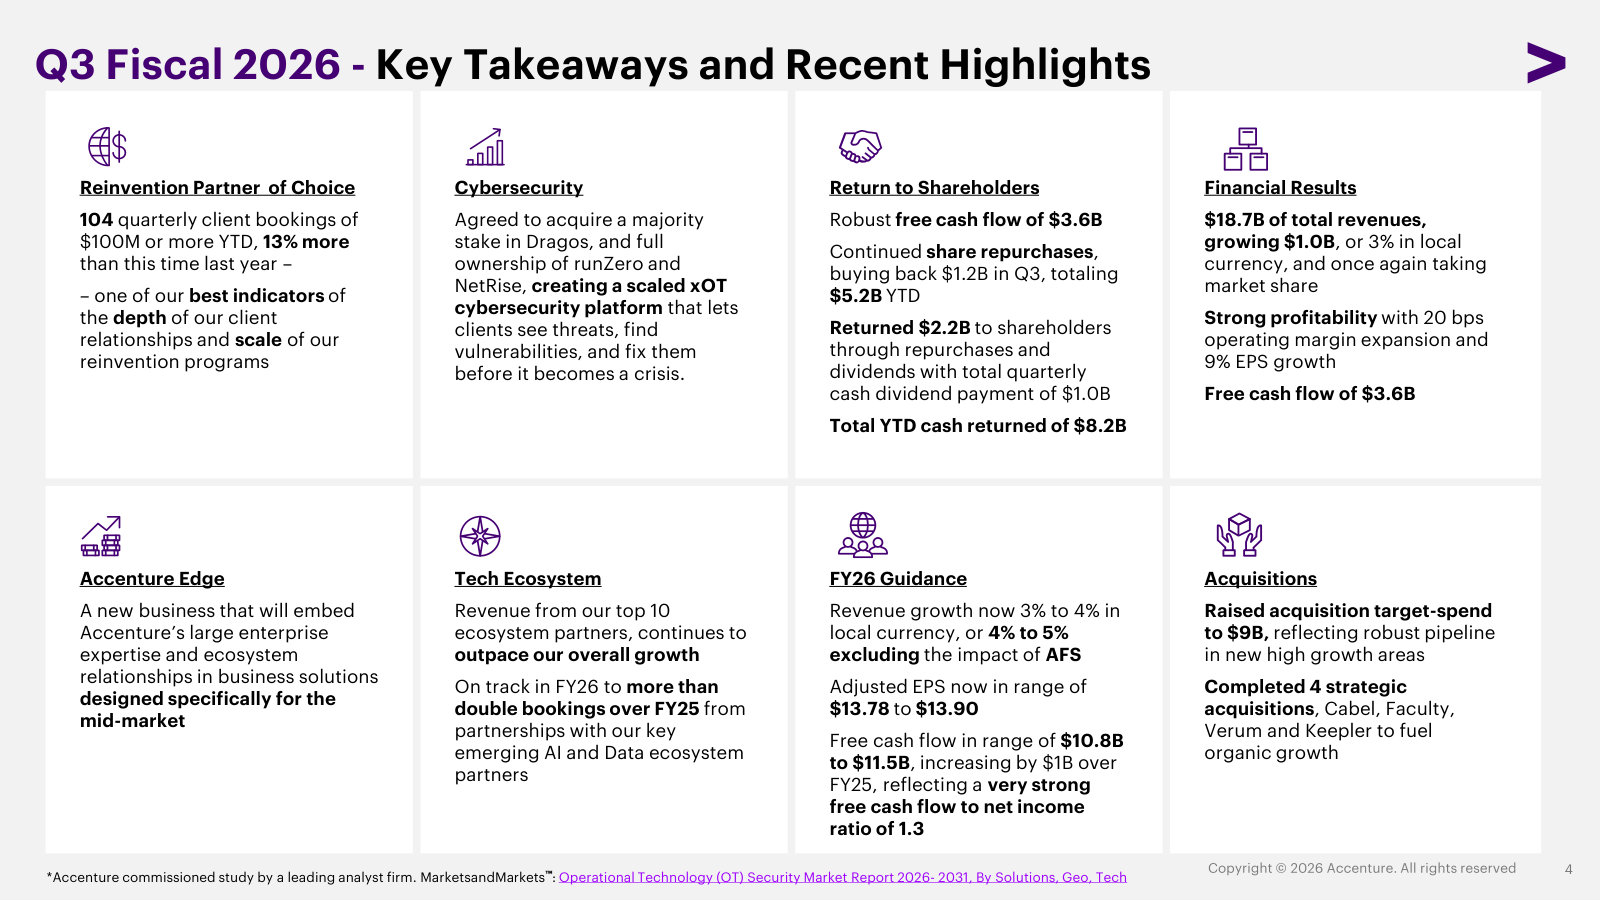
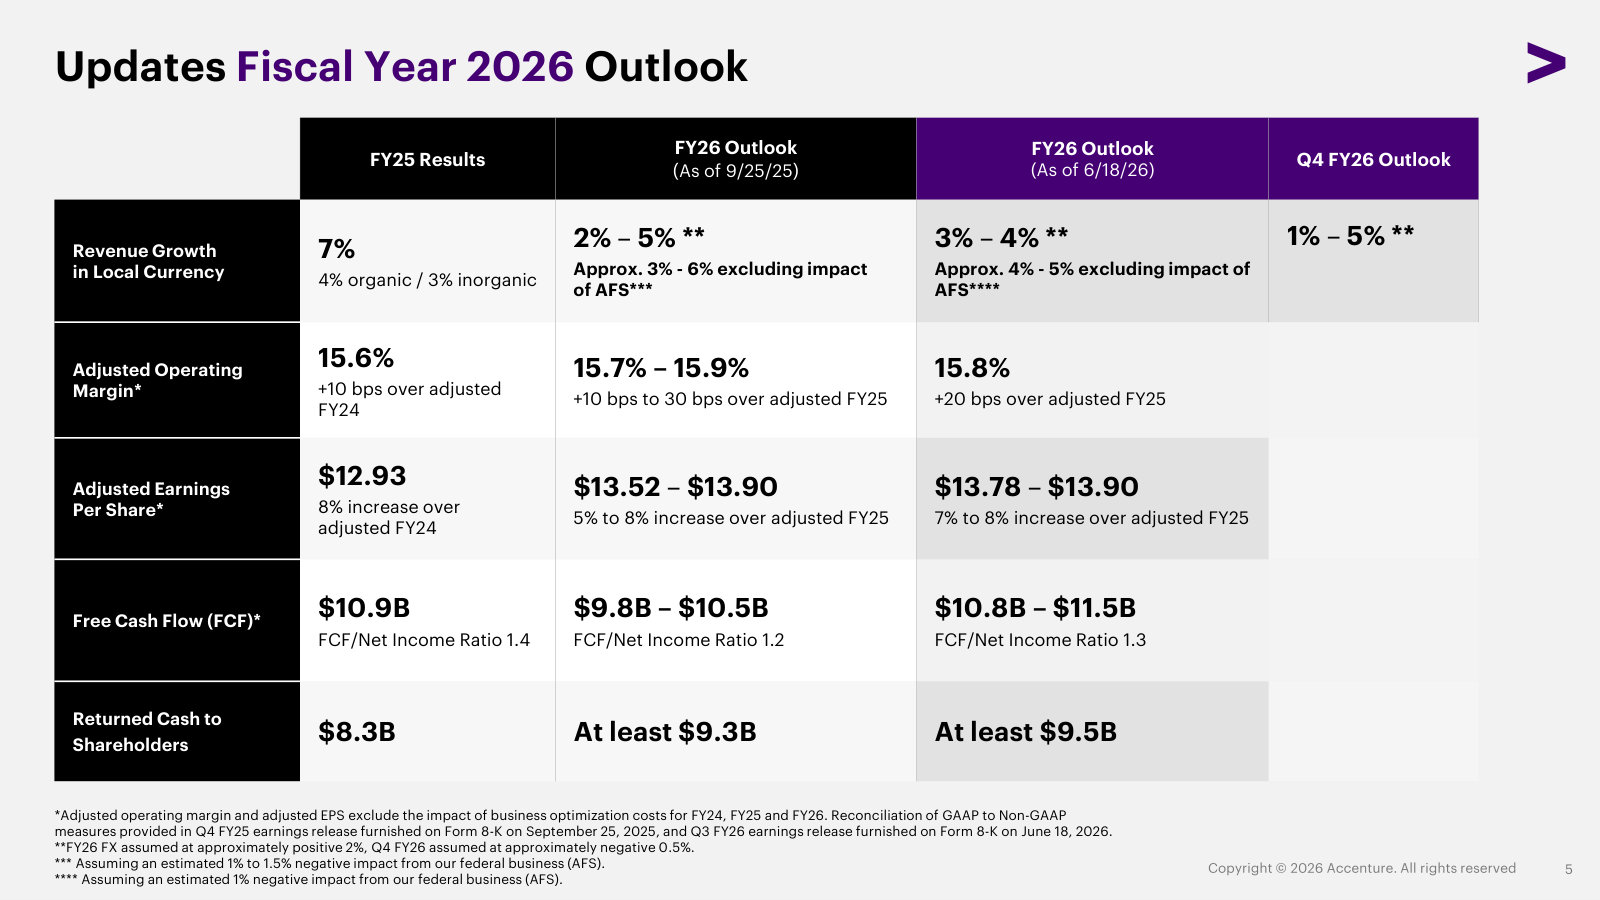
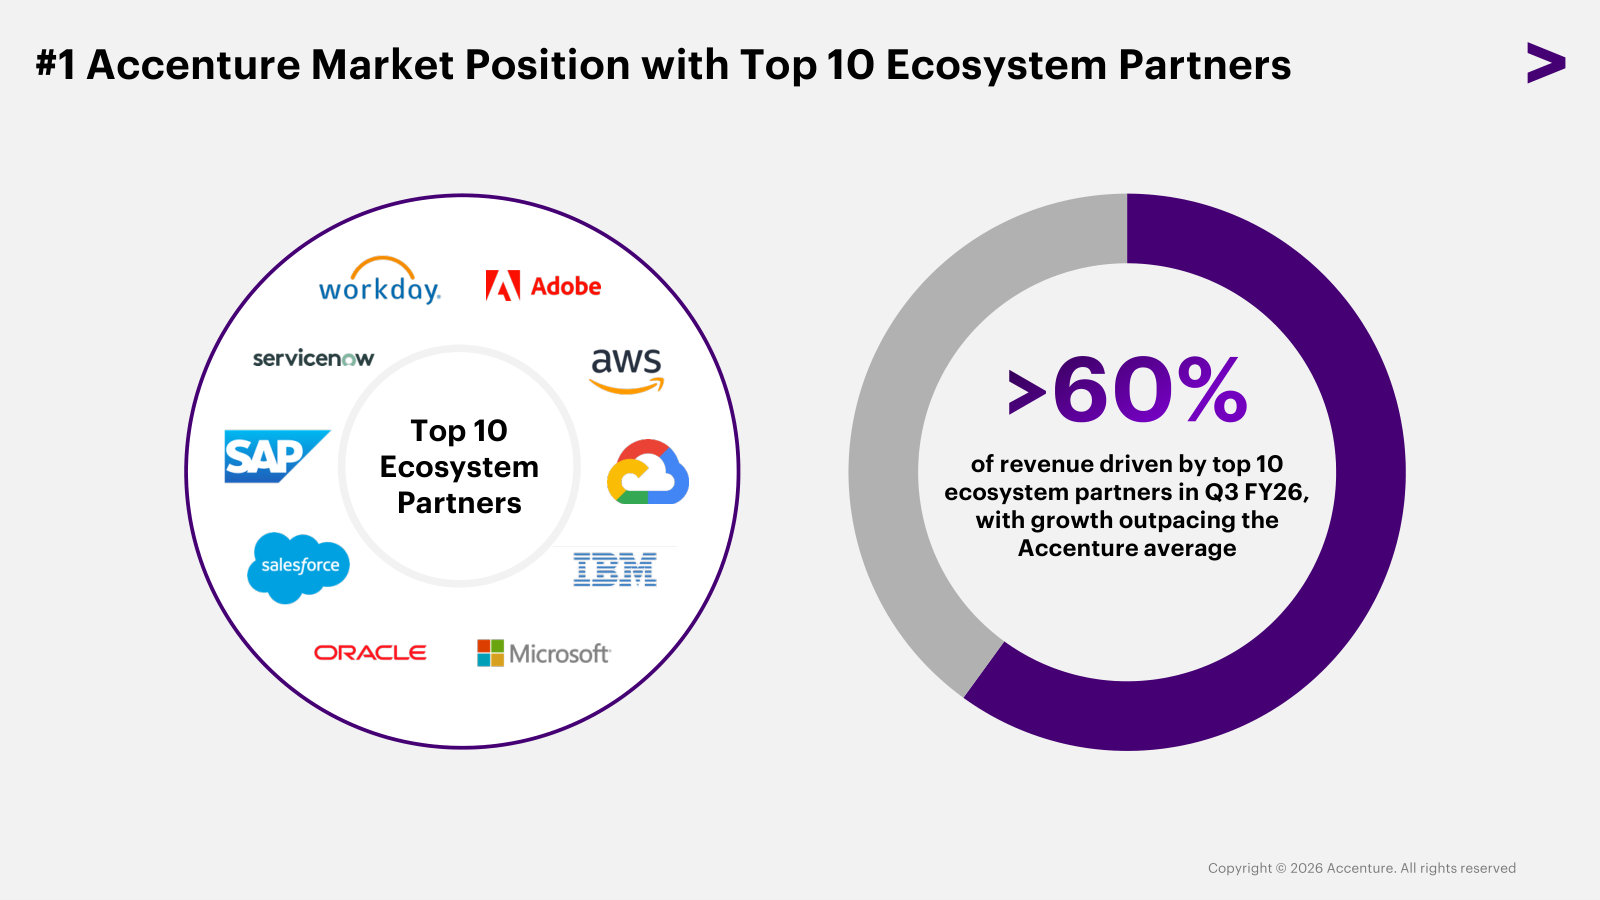
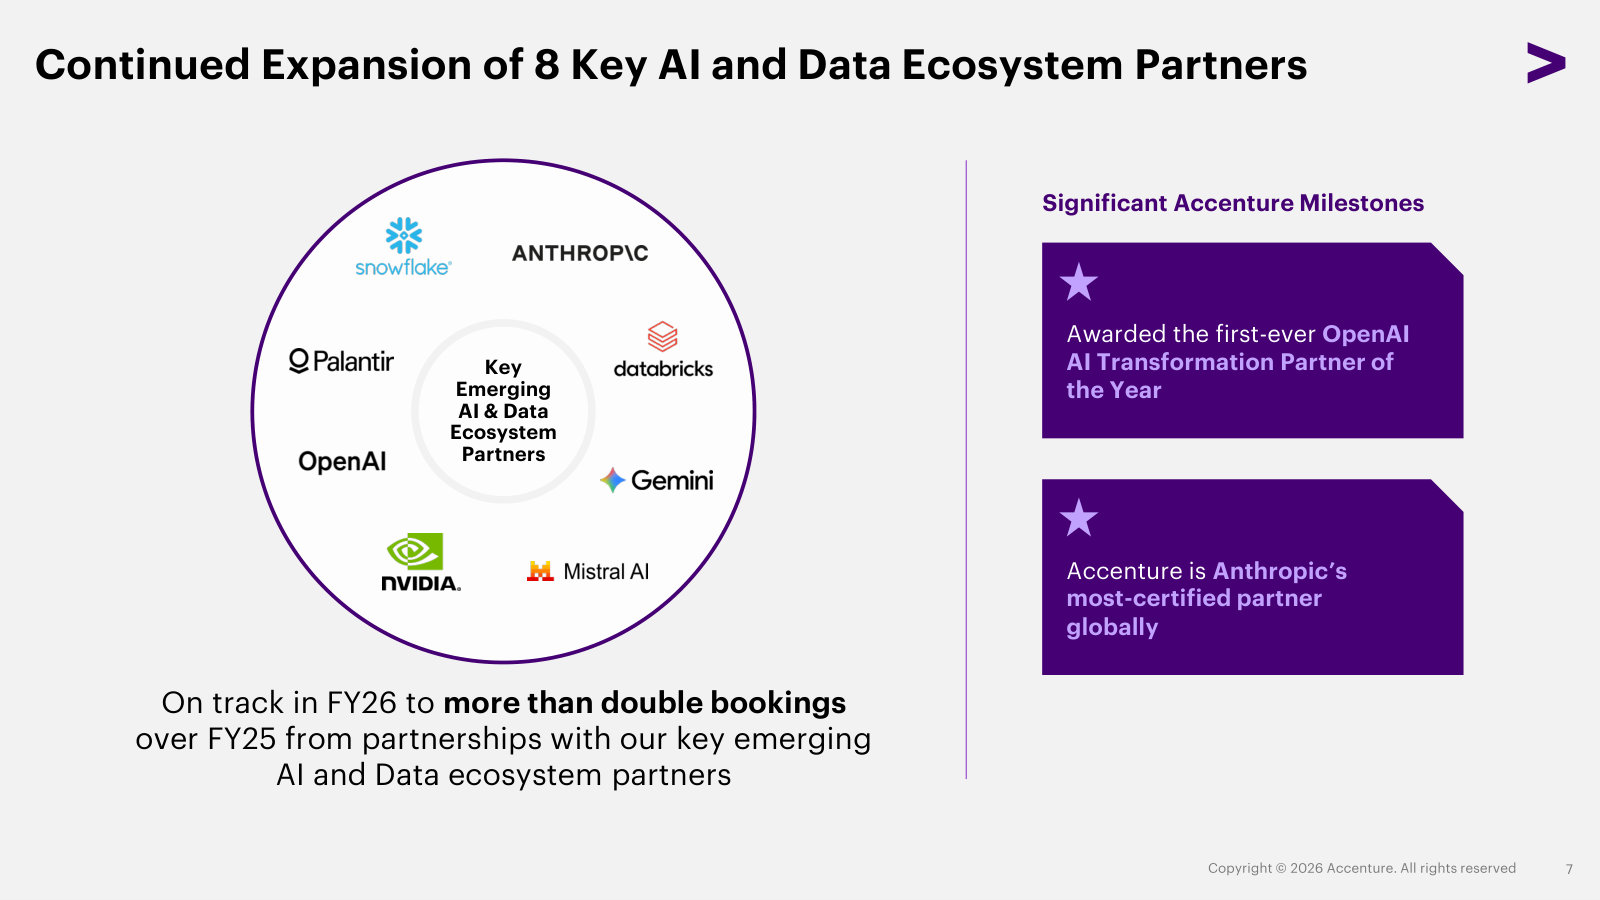
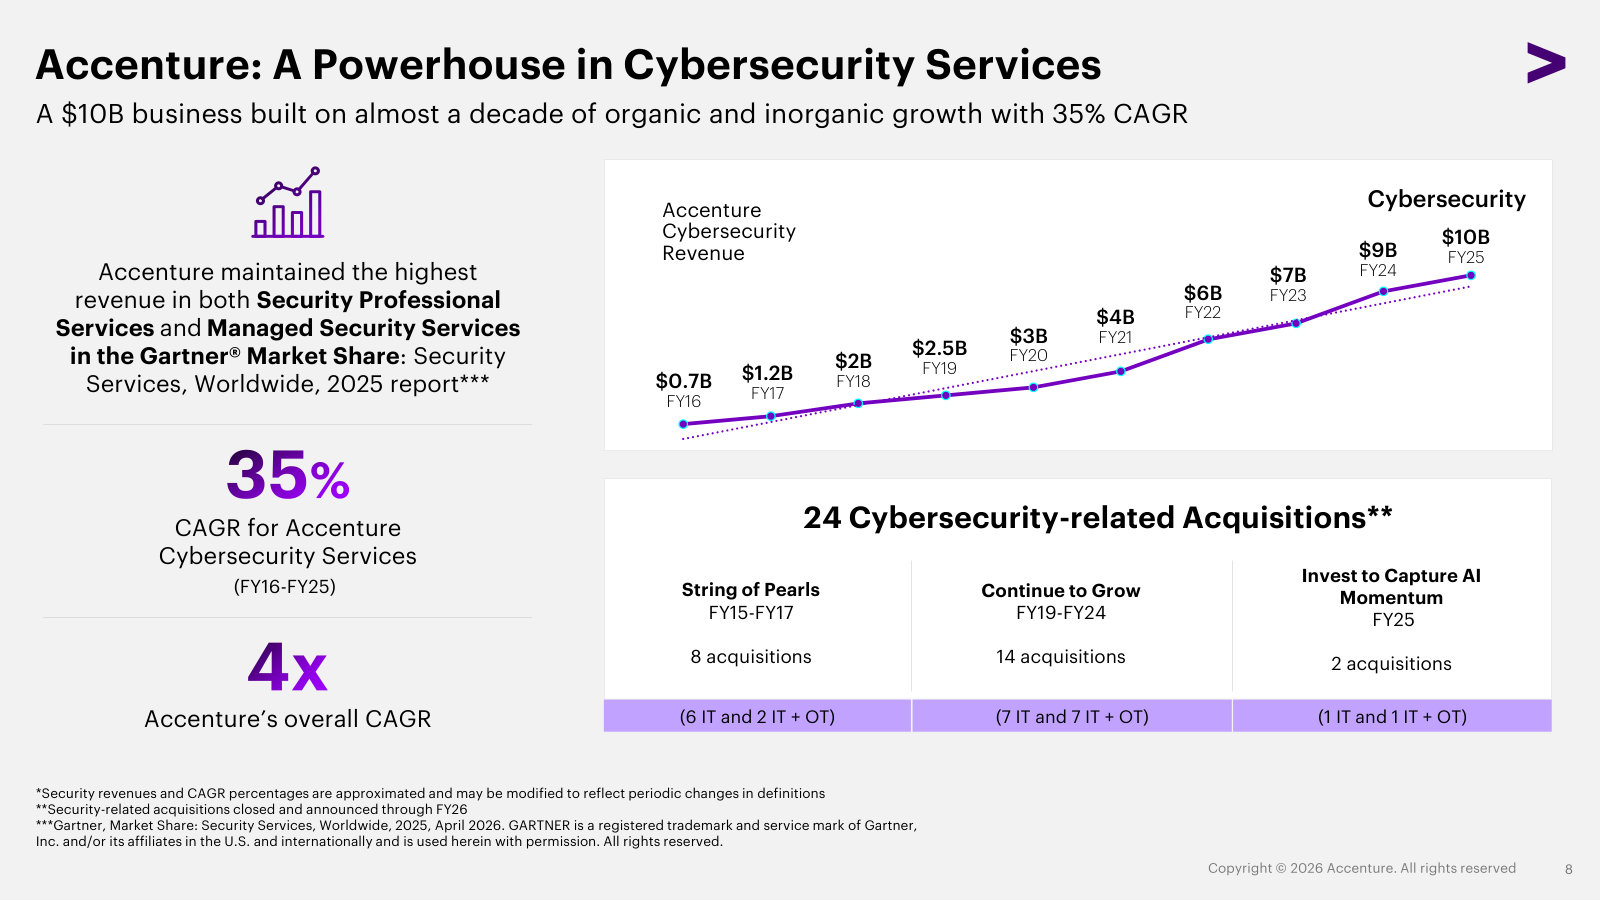
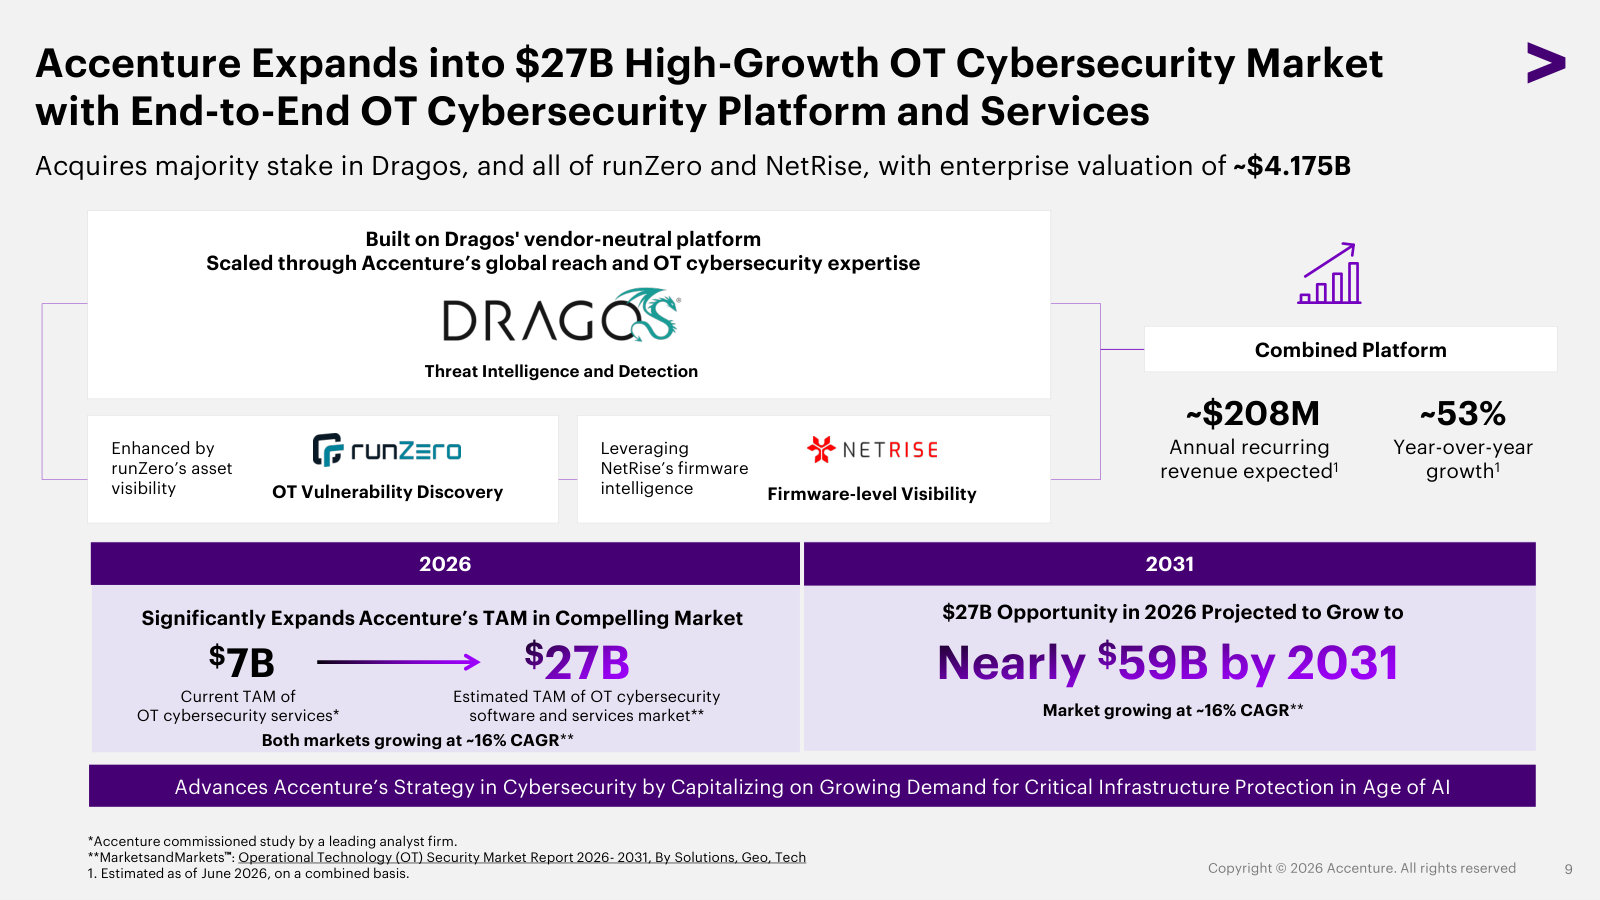
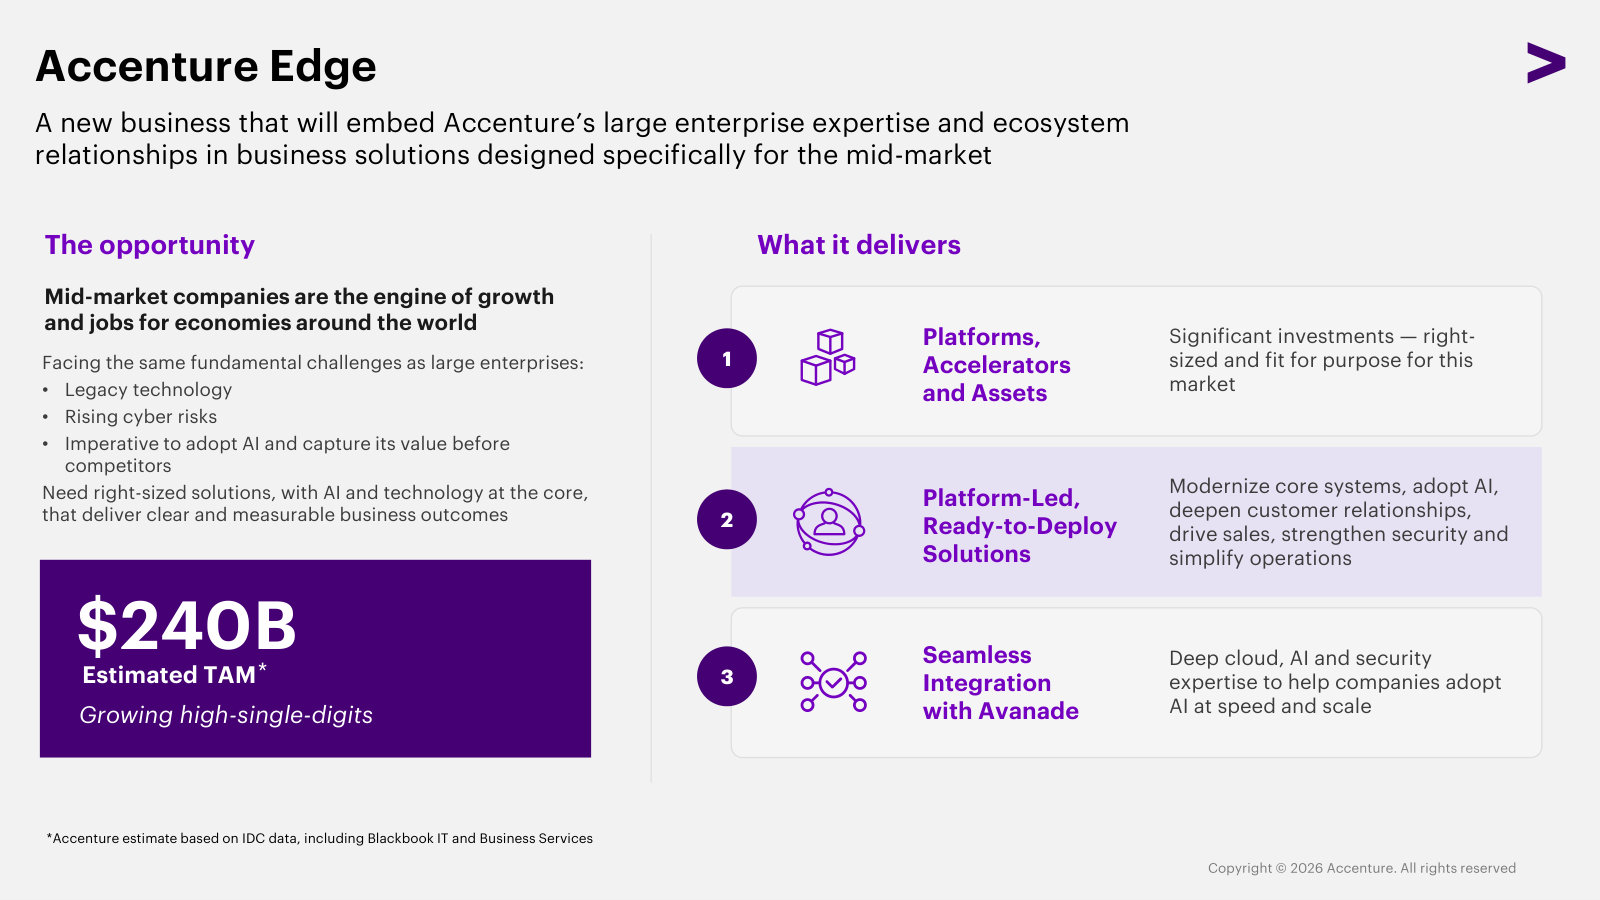
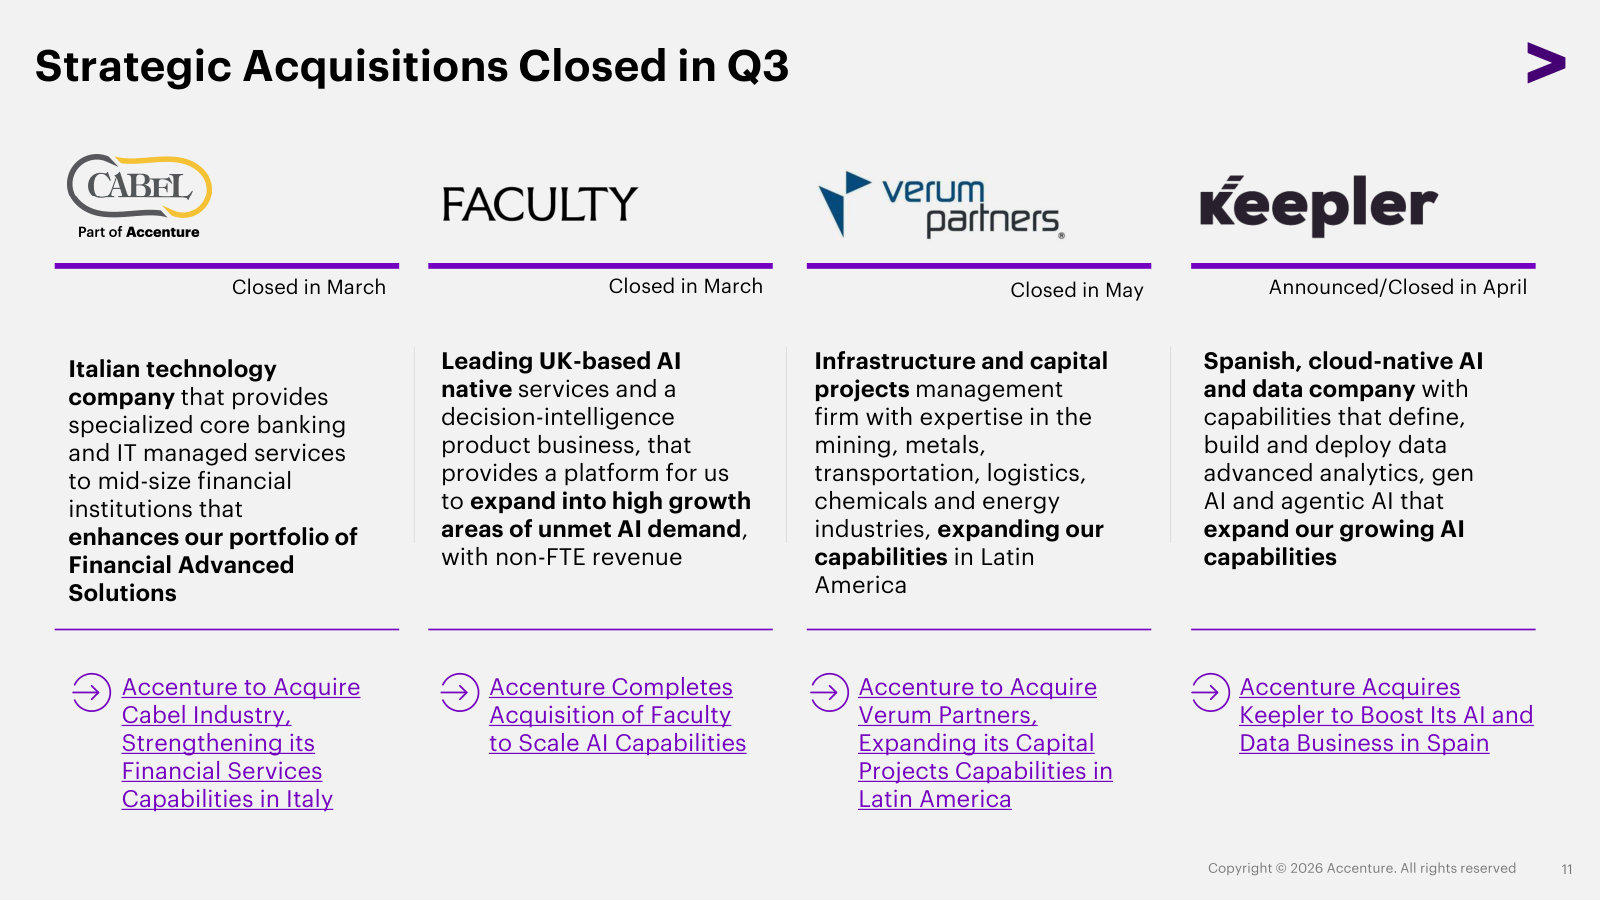
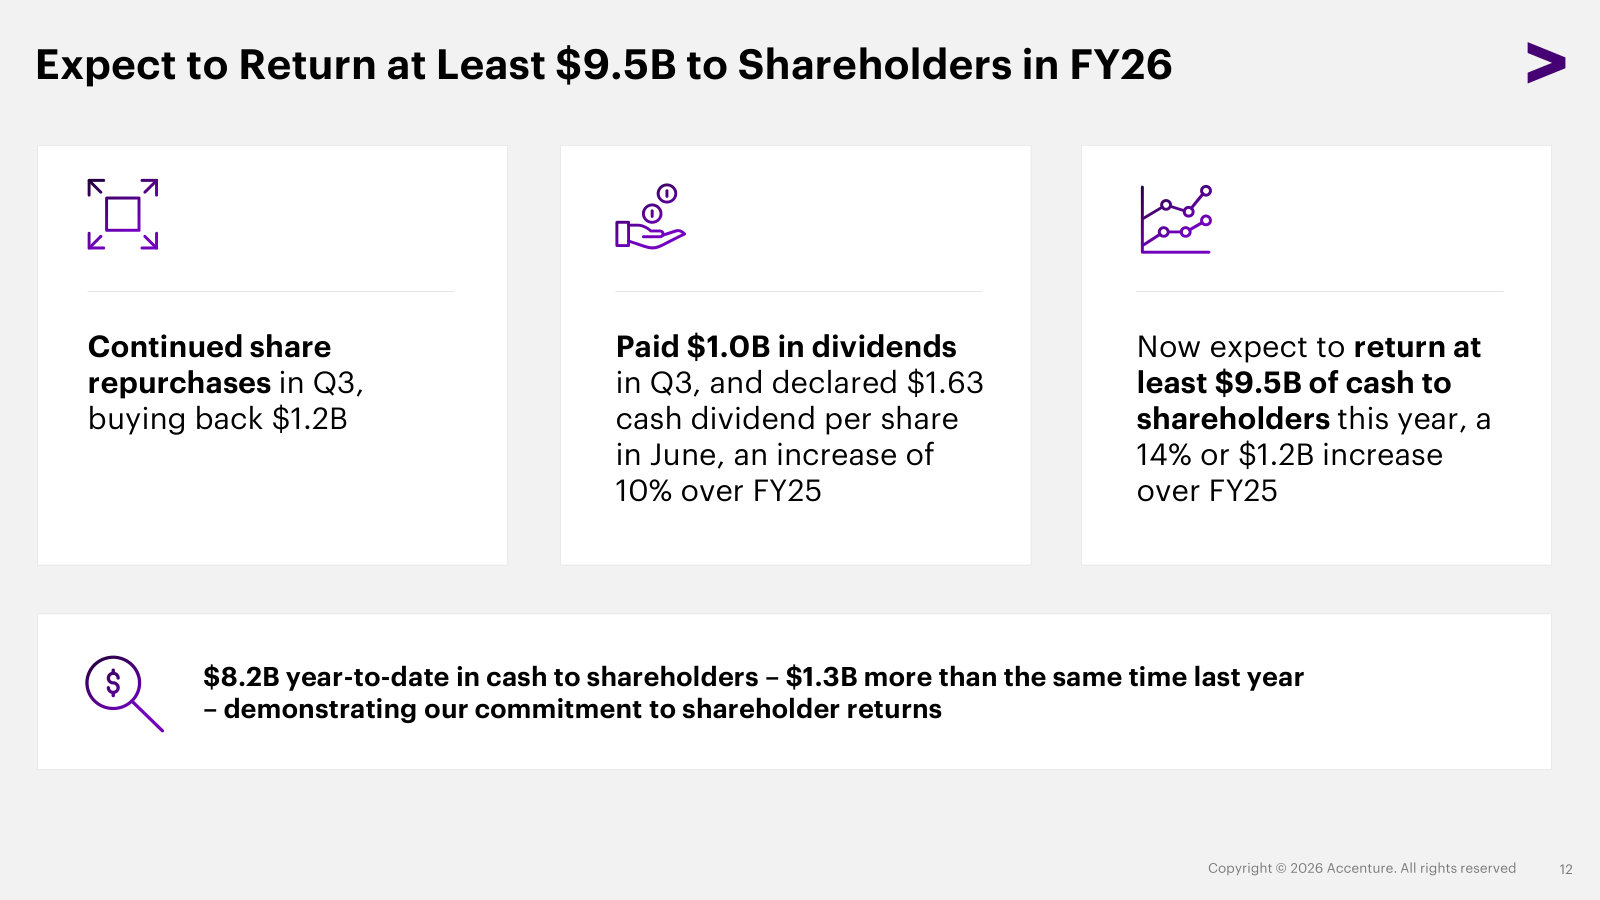
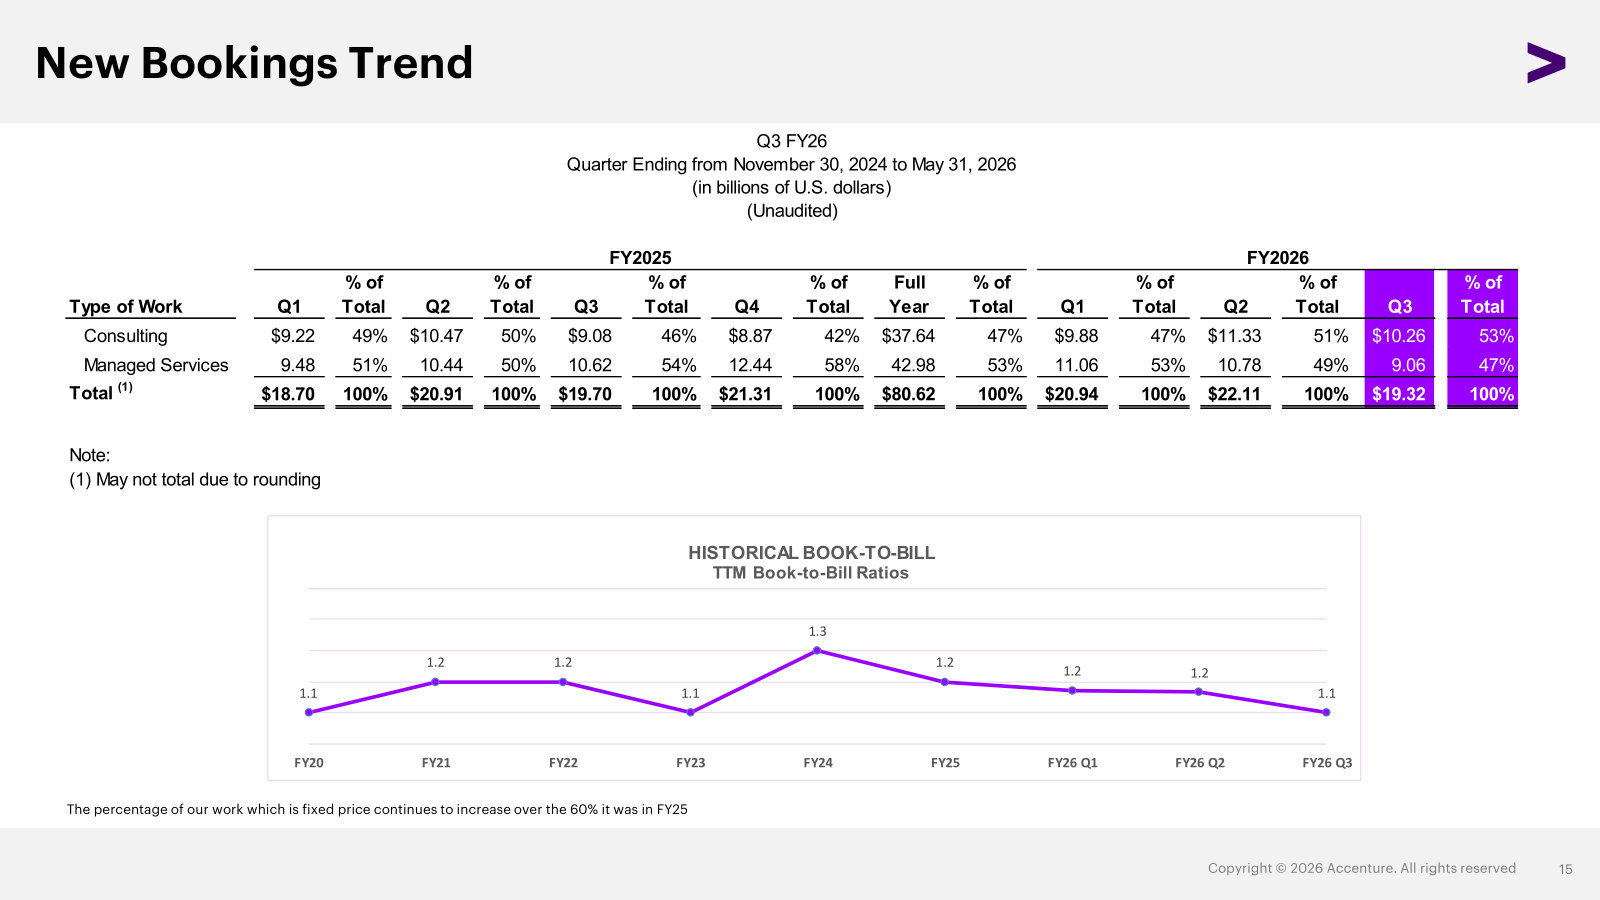
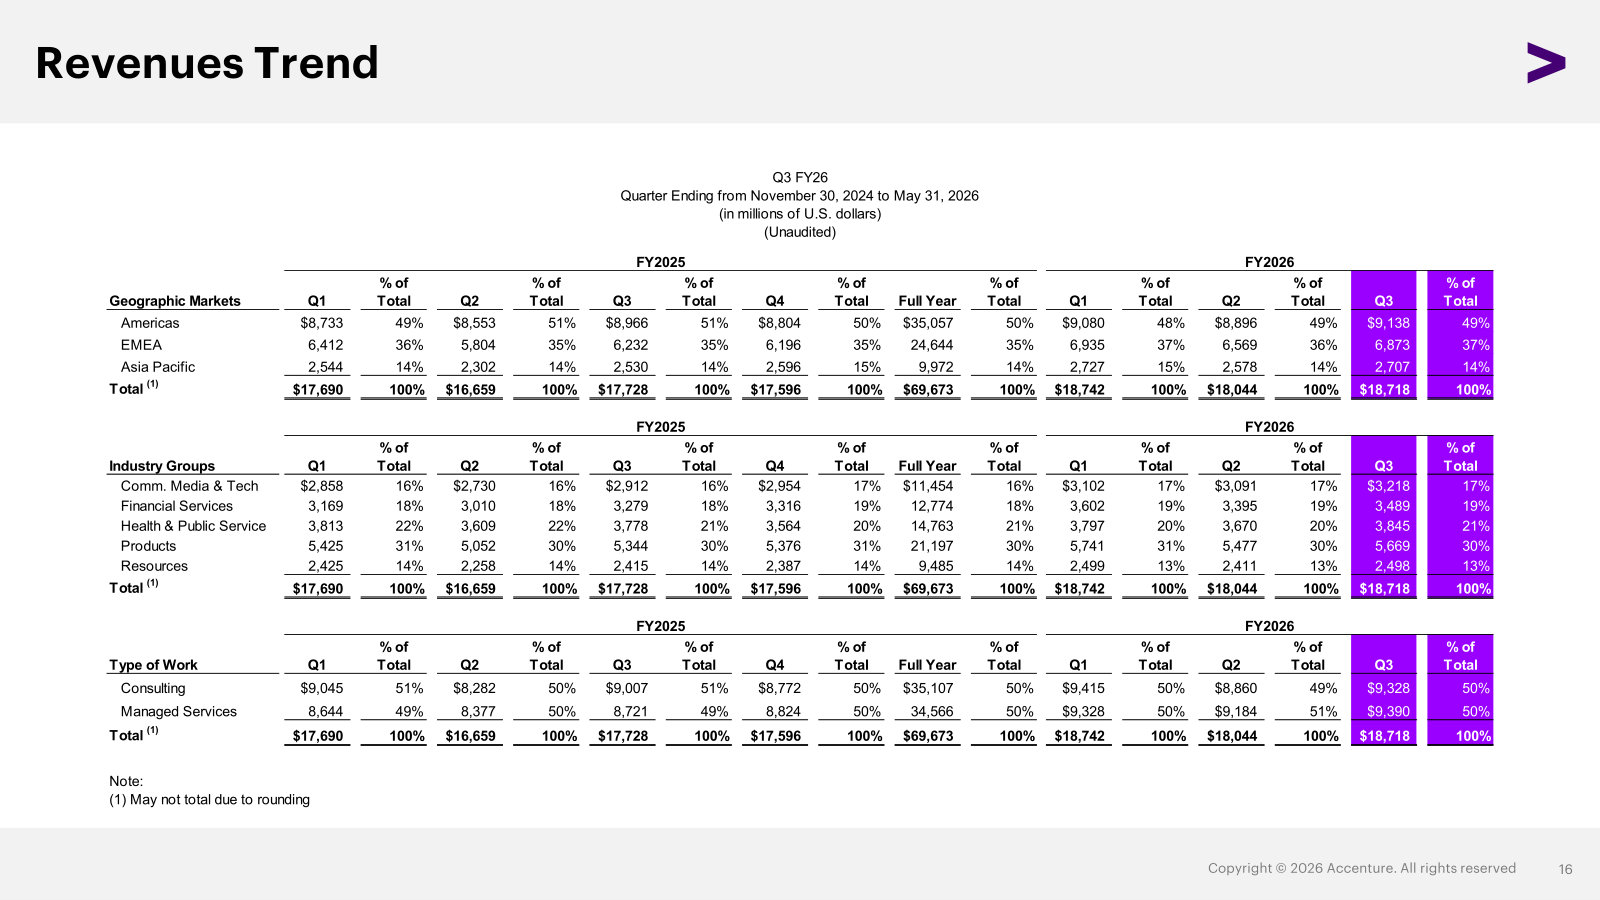
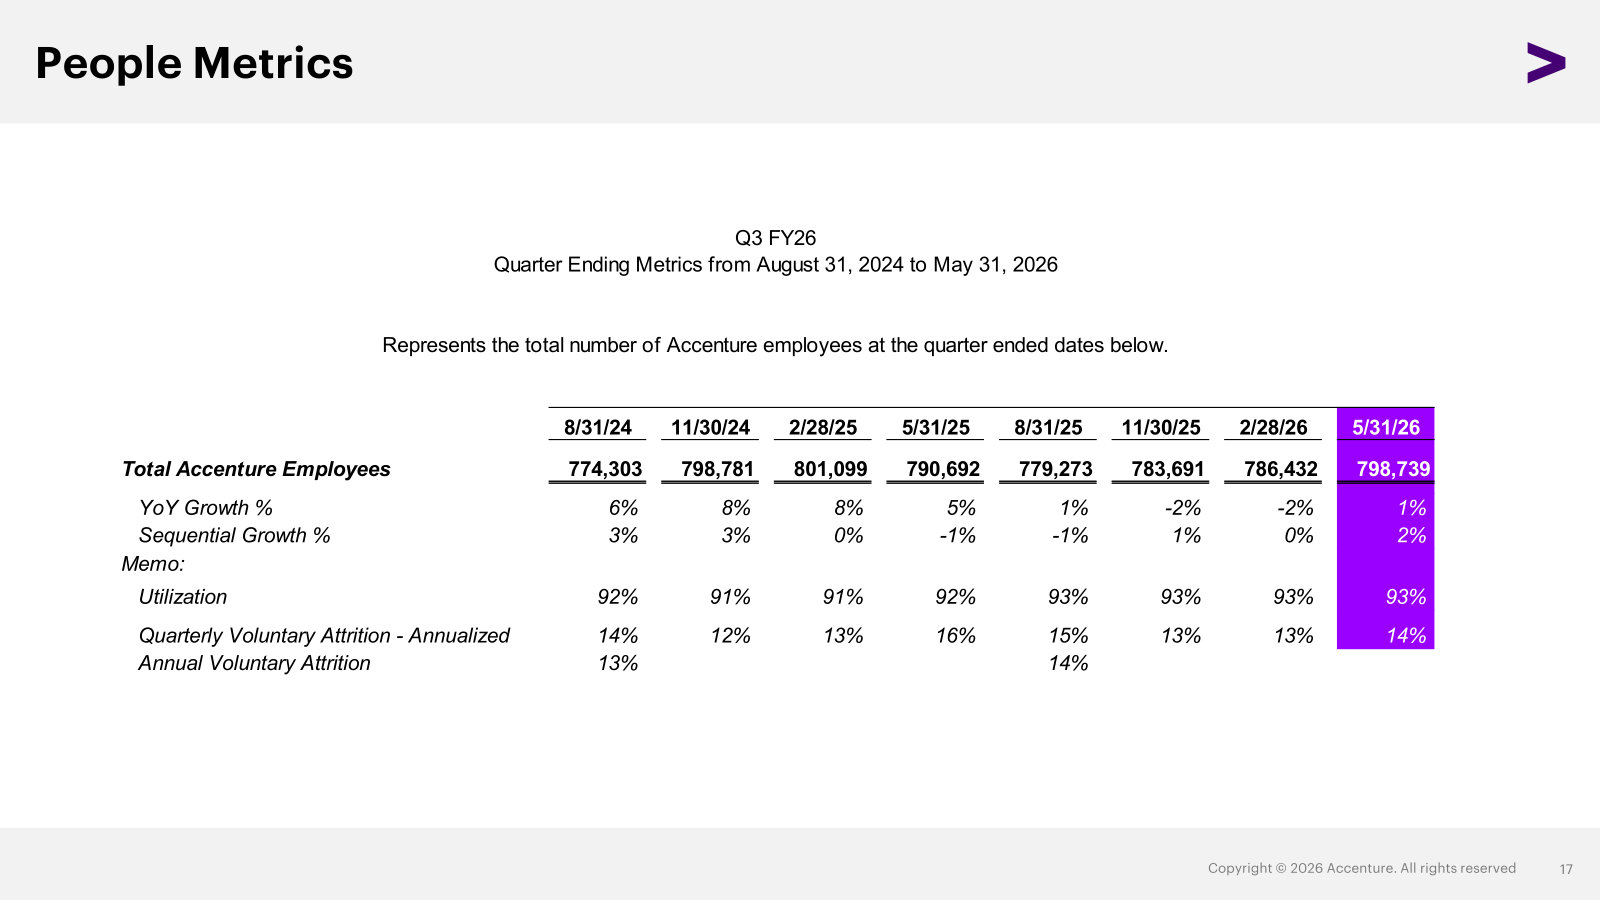
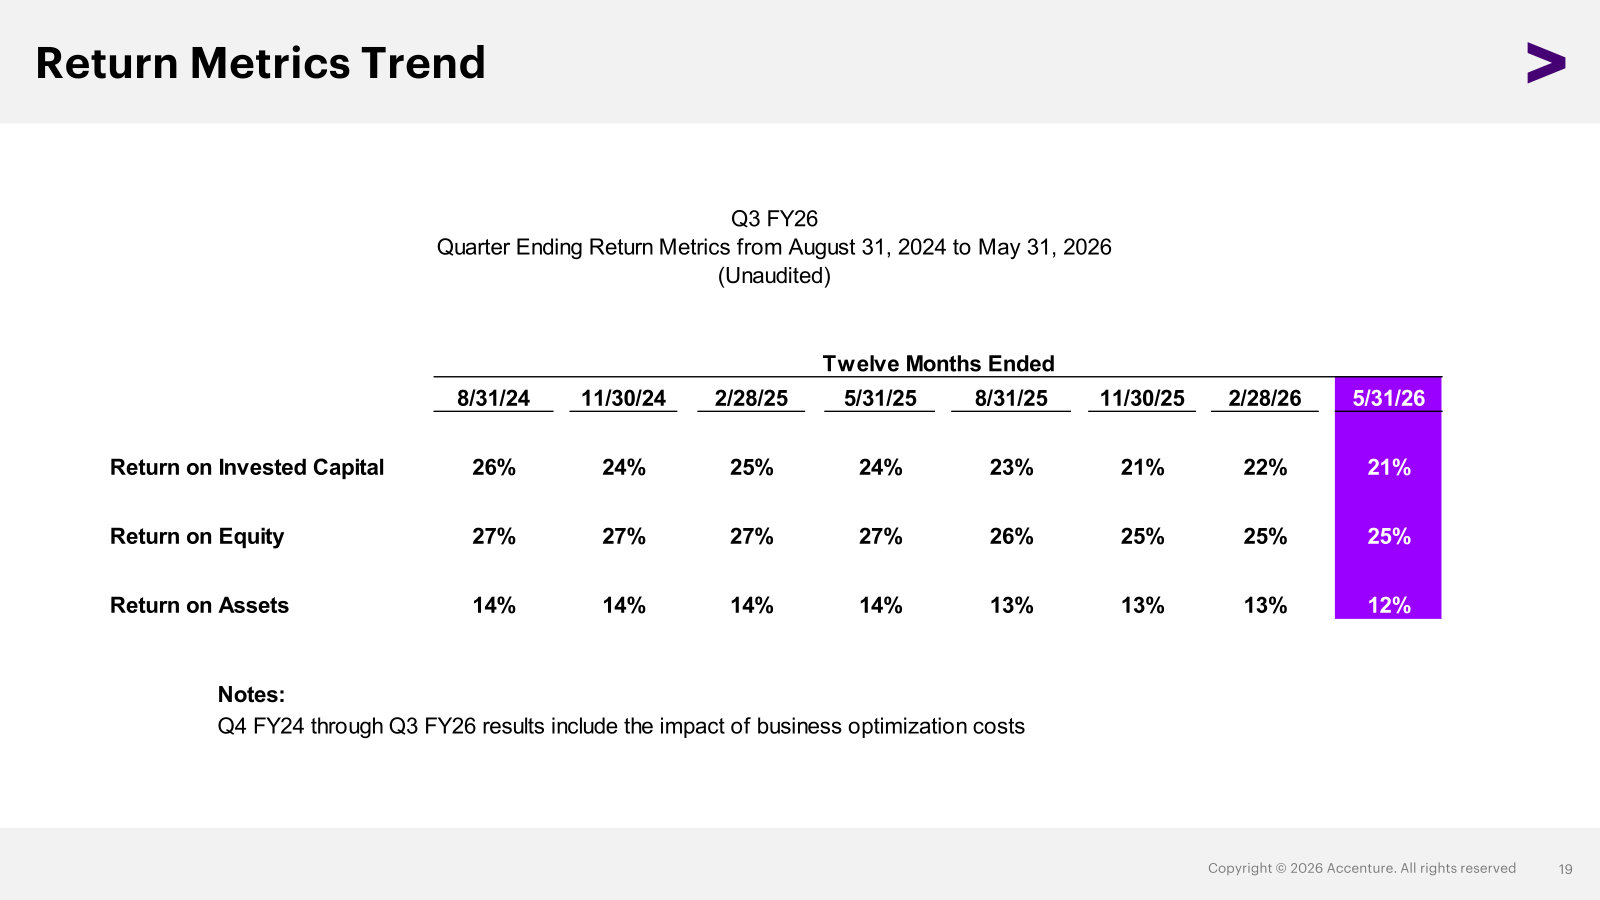
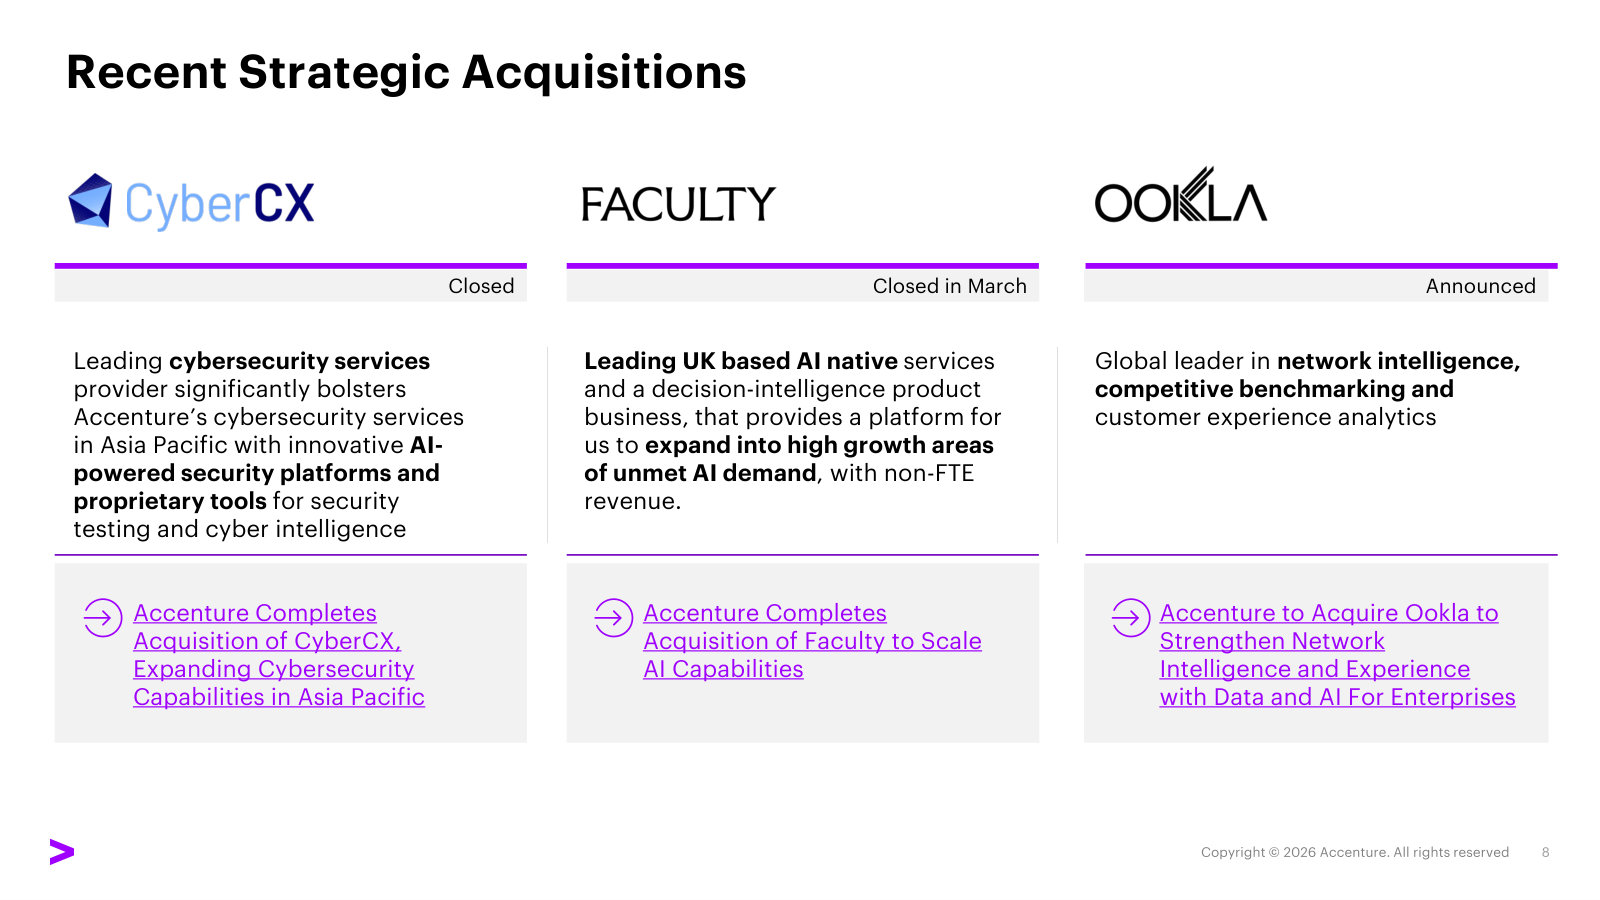
p. 2 — One page showing how the $18.7B quarter splits across geographies, five industry groups, and consulting vs. managed services. · Open the full presentation →p. 3 — The same cut for the nine months: $55.5B of revenue, $62.4B of bookings, and where growth is and isn't. · Open the full presentation →p. 4 — Management's own summary of the quarter — client concentration at the top, cybersecurity M&A, guidance, and cash returned. · Open the full presentation →p. 5 — The FY26 guidance table, with the original September outlook next to the June revision — how the year has actually tracked. · Open the full presentation →p. 6 — Over 60% of revenue is tied to ten software partners, all named here — the dependency that defines the business model. · Open the full presentation →p. 7 — The eight newer AI and data partners Accenture is attaching itself to, and the bookings claim made for them. · Open the full presentation →p. 8 — Cybersecurity from $0.7B in FY16 to $10B in FY25, with the acquisitions behind it — the template for how Accenture enters a market. · Open the full presentation →p. 9 — The ~$4.175B Dragos, runZero and NetRise deal, the OT security TAM it buys into, and the recurring revenue actually acquired. · Open the full presentation →p. 10 — Accenture Edge: the new mid-market business, its claimed $240B TAM, and what the offering consists of. · Open the full presentation →p. 11 — The four deals closed in Q3 and what each one adds — a concrete look at the tuck-in acquisition programme. · Open the full presentation →p. 12 — The FY26 capital return plan: at least $9.5B expected, split between buybacks and a dividend raised 10%. · Open the full presentation →p. 15 — Bookings by type of work back to FY25, with the trailing book-to-bill line — the leading indicator for revenue. · Open the full presentation →p. 16 — The full revenue mix table: geography, industry group and type of work by quarter, with percentage shares. · Open the full presentation →p. 17 — Headcount, utilization and attrition by quarter — the unit economics of a business that sells its people's time. · Open the full presentation →p. 19 — ROIC, ROE and ROA across eight quarters; capital efficiency has drifted down over the period. · Open the full presentation →
Featured for two exhibits the other decks don't carry: the first-half acquisitions and the analyst-ranking map of the competitive field. · Open the full document →
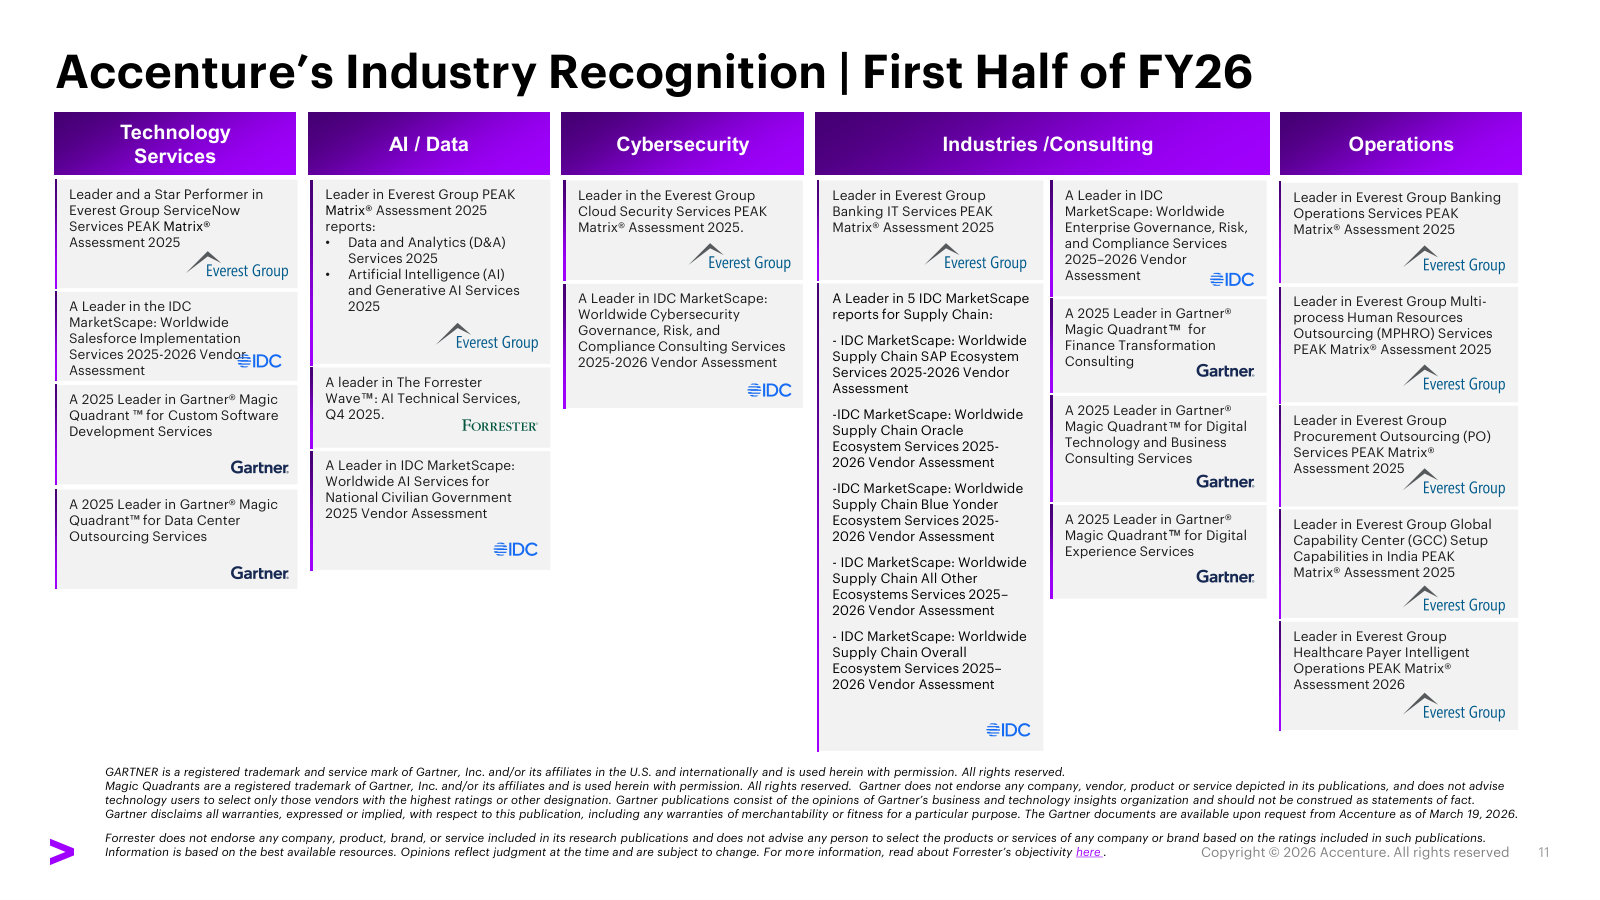
p. 8 — CyberCX, Faculty and Ookla — the three deals that carried the first half, and the capability each was bought for. · Open the full presentation →p. 11 — Analyst rankings across technology, AI, cybersecurity, consulting and operations — the competitive position in one grid. · Open the full presentation →
Three structural explainers found nowhere else here: the shift to fixed price, the scale of advanced AI, and what Song actually is. · Open the full document →
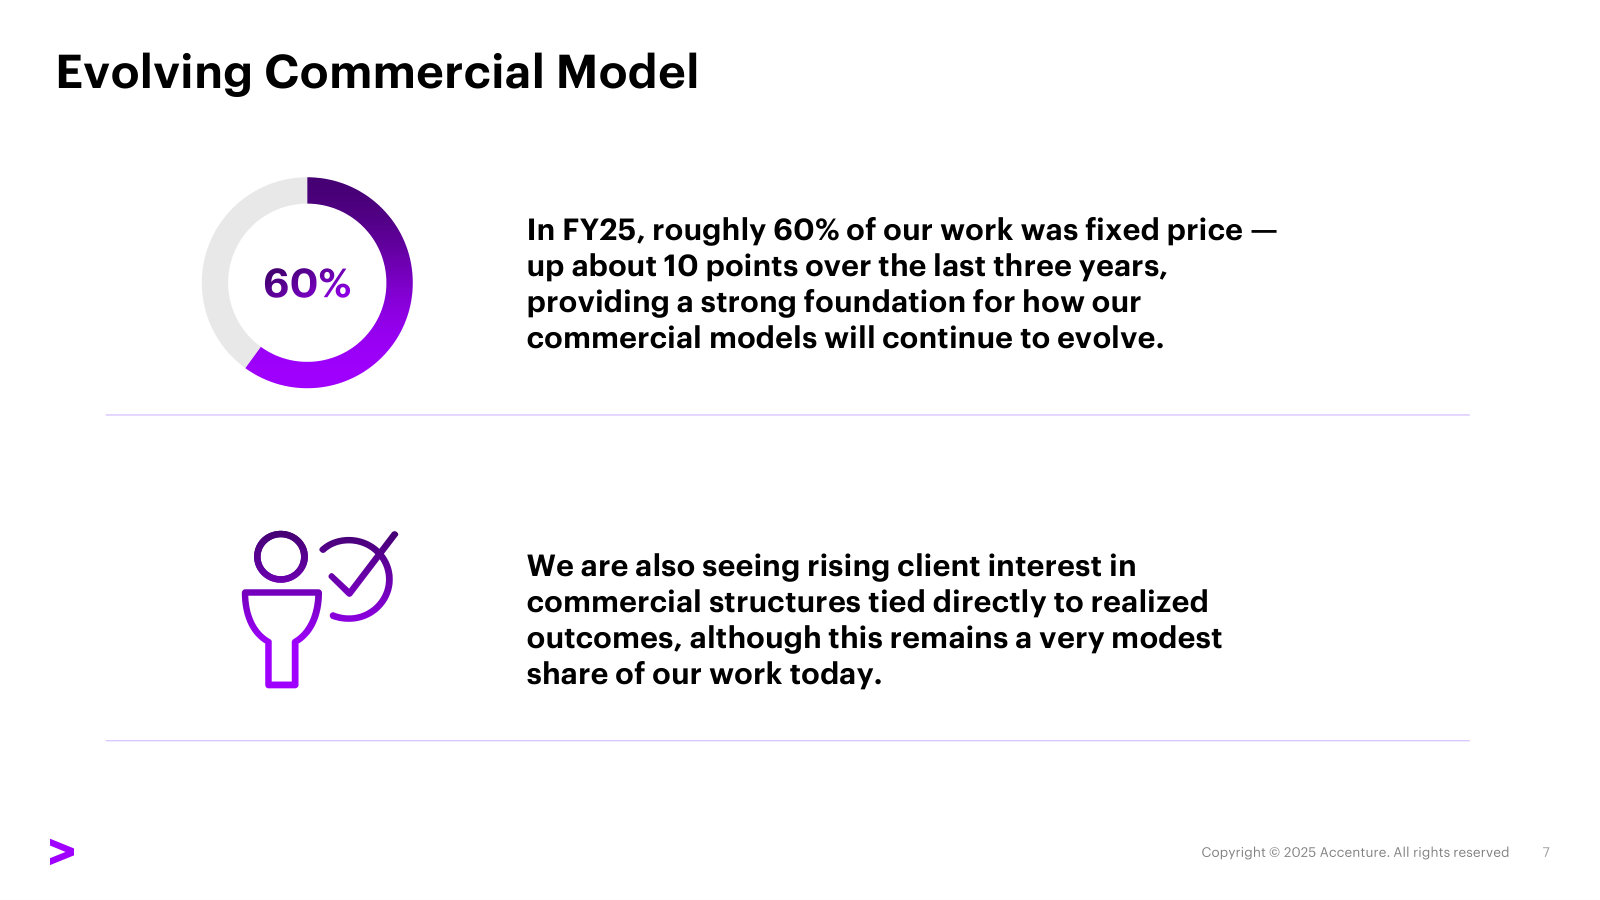
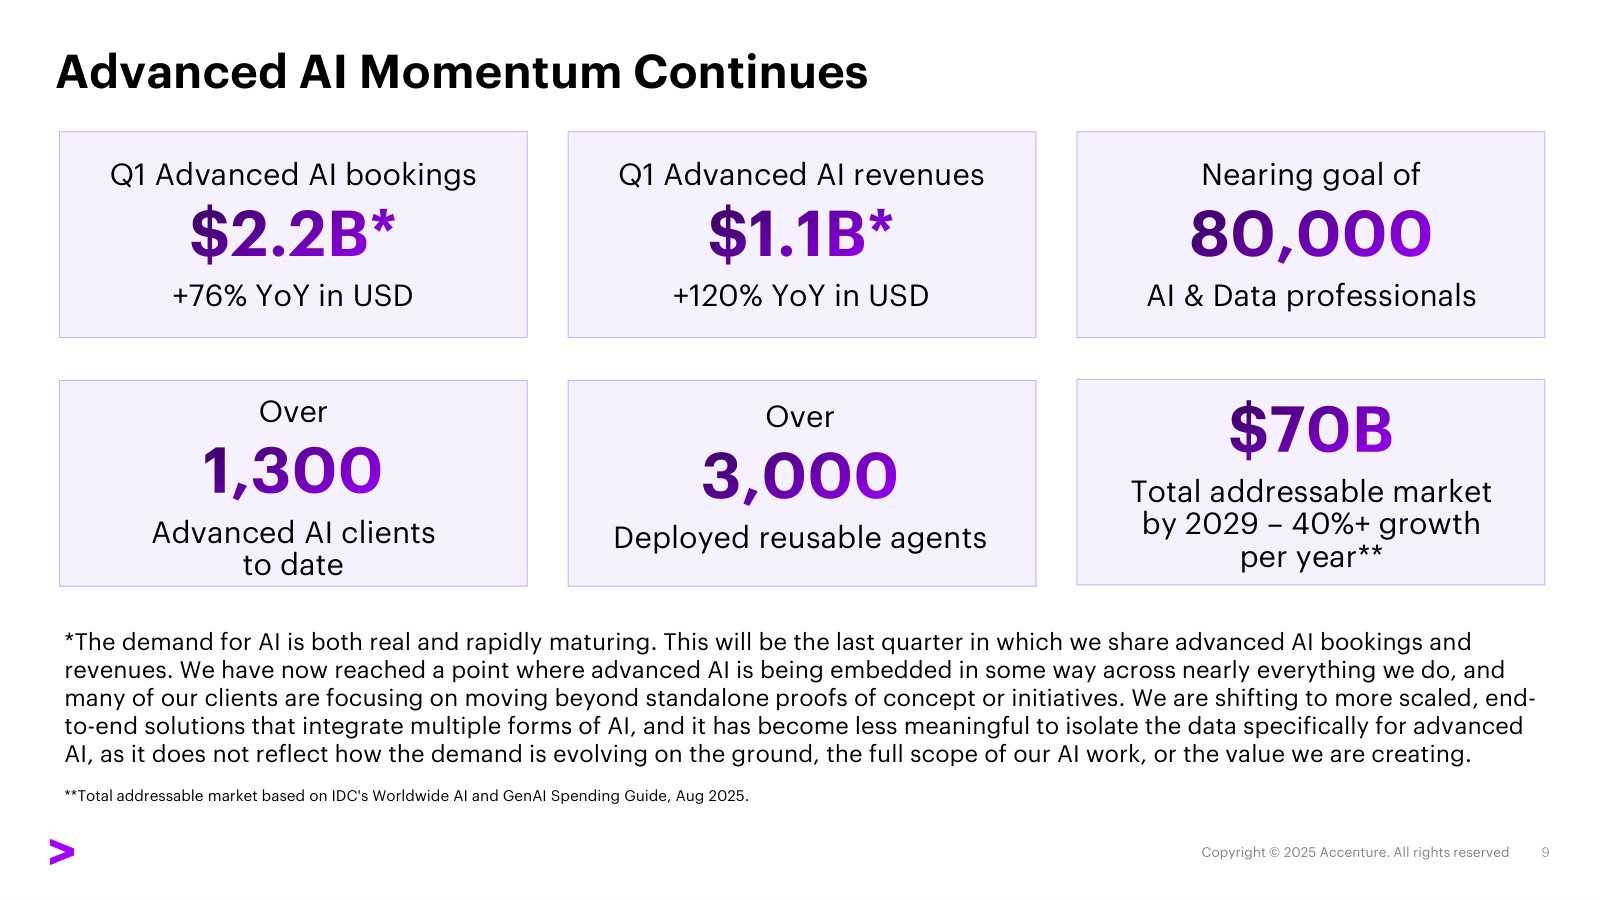
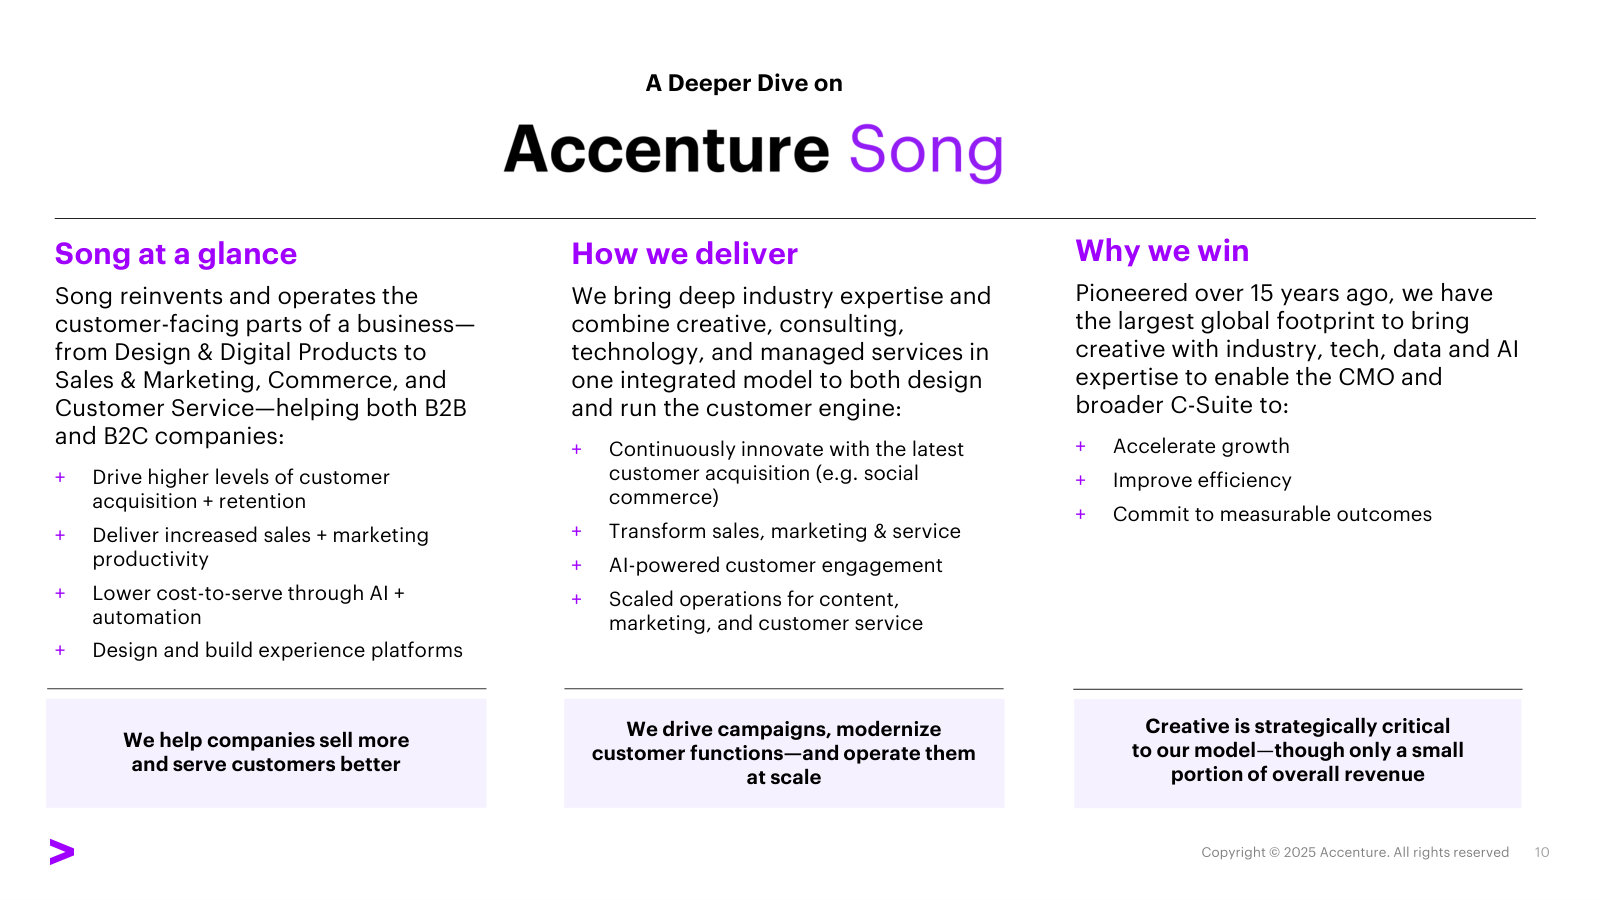
p. 7 — Roughly 60% of work is now fixed price, up about ten points in three years — Accenture taking on more delivery risk. · Open the full presentation →p. 9 — The last disclosure of advanced-AI bookings and revenue before management folded them into the base, plus the $70B TAM claim. · Open the full presentation →p. 10 — A rare segment explainer: what Accenture Song does, how it delivers, and the note that creative is a small share of revenue. · Open the full presentation →
The full-year deck: the cleanest annual picture of the business, plus management's account of how it grows — AI, acquisitions, new lines. · Open the full document →
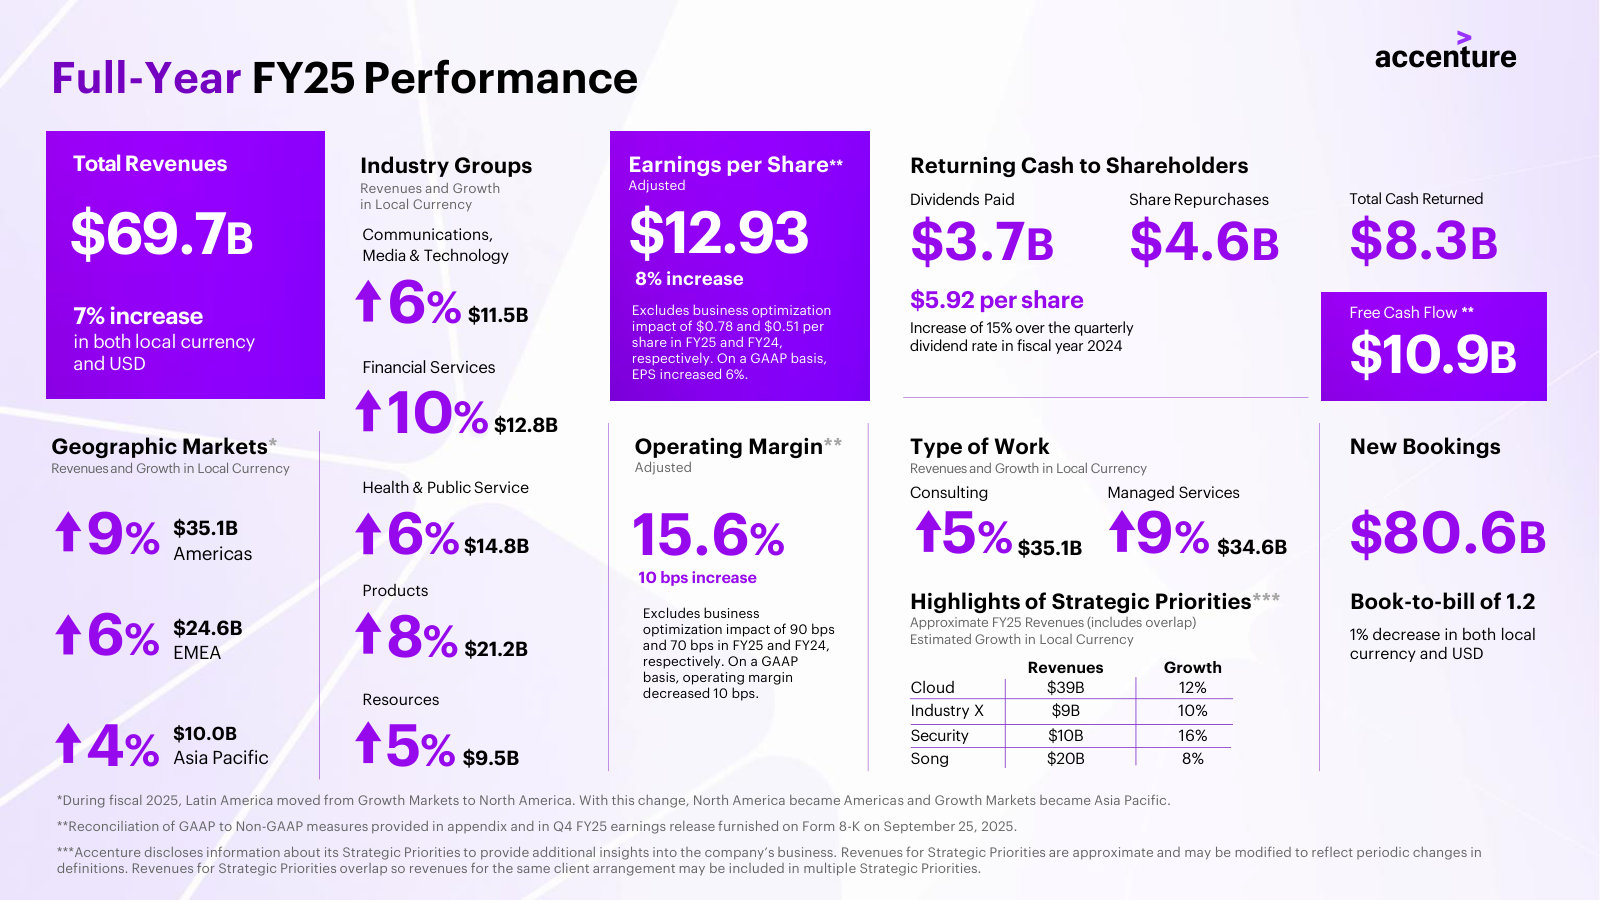
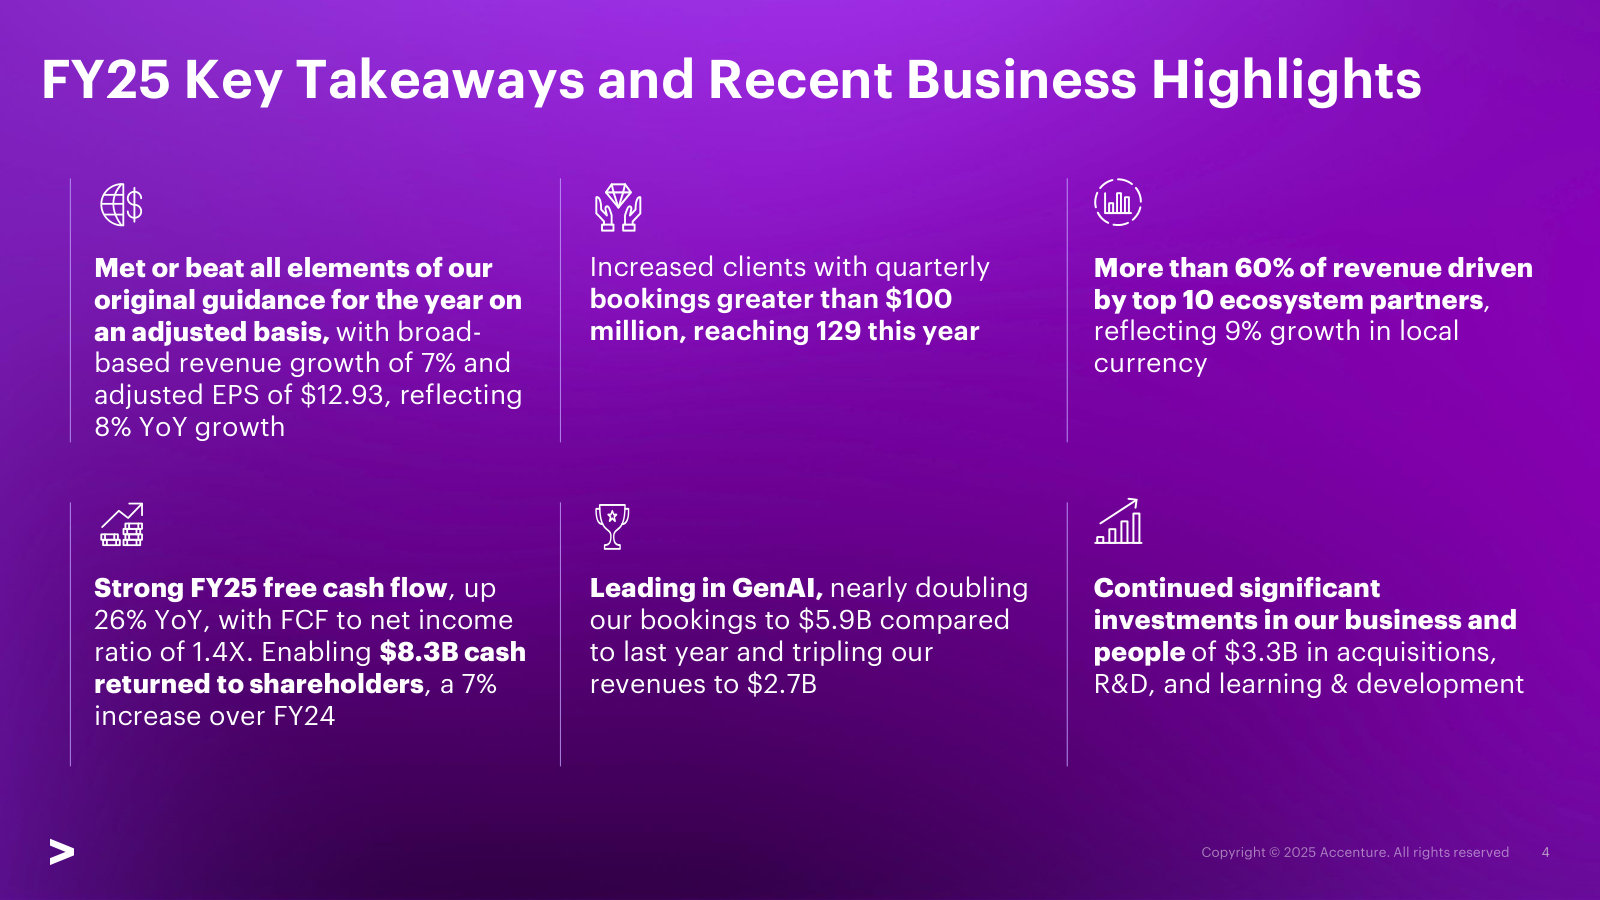
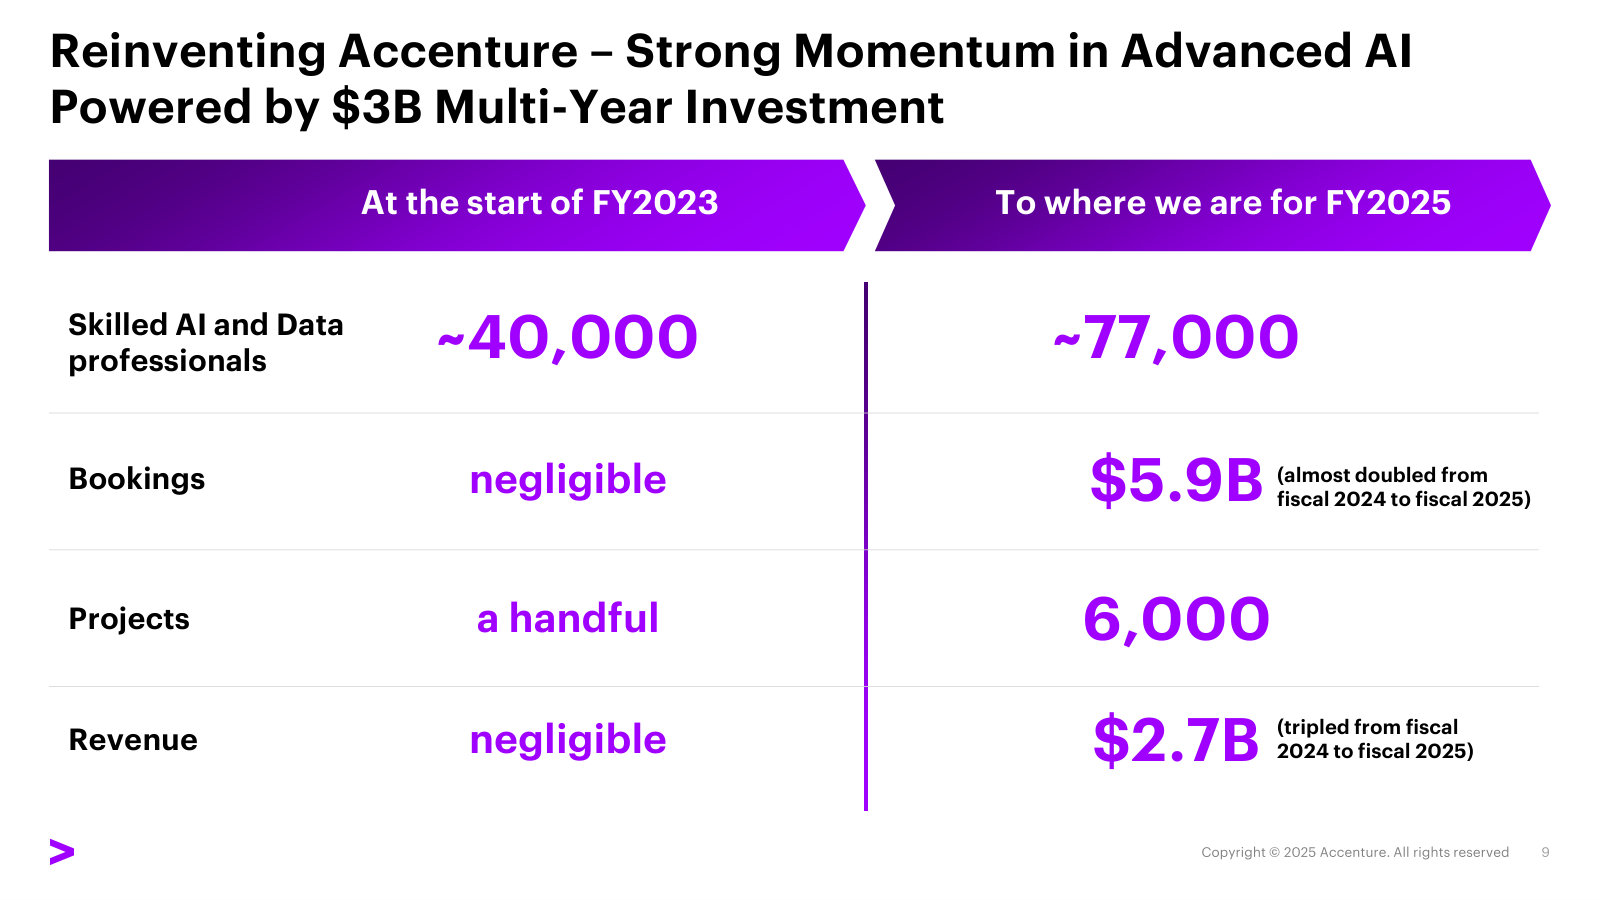
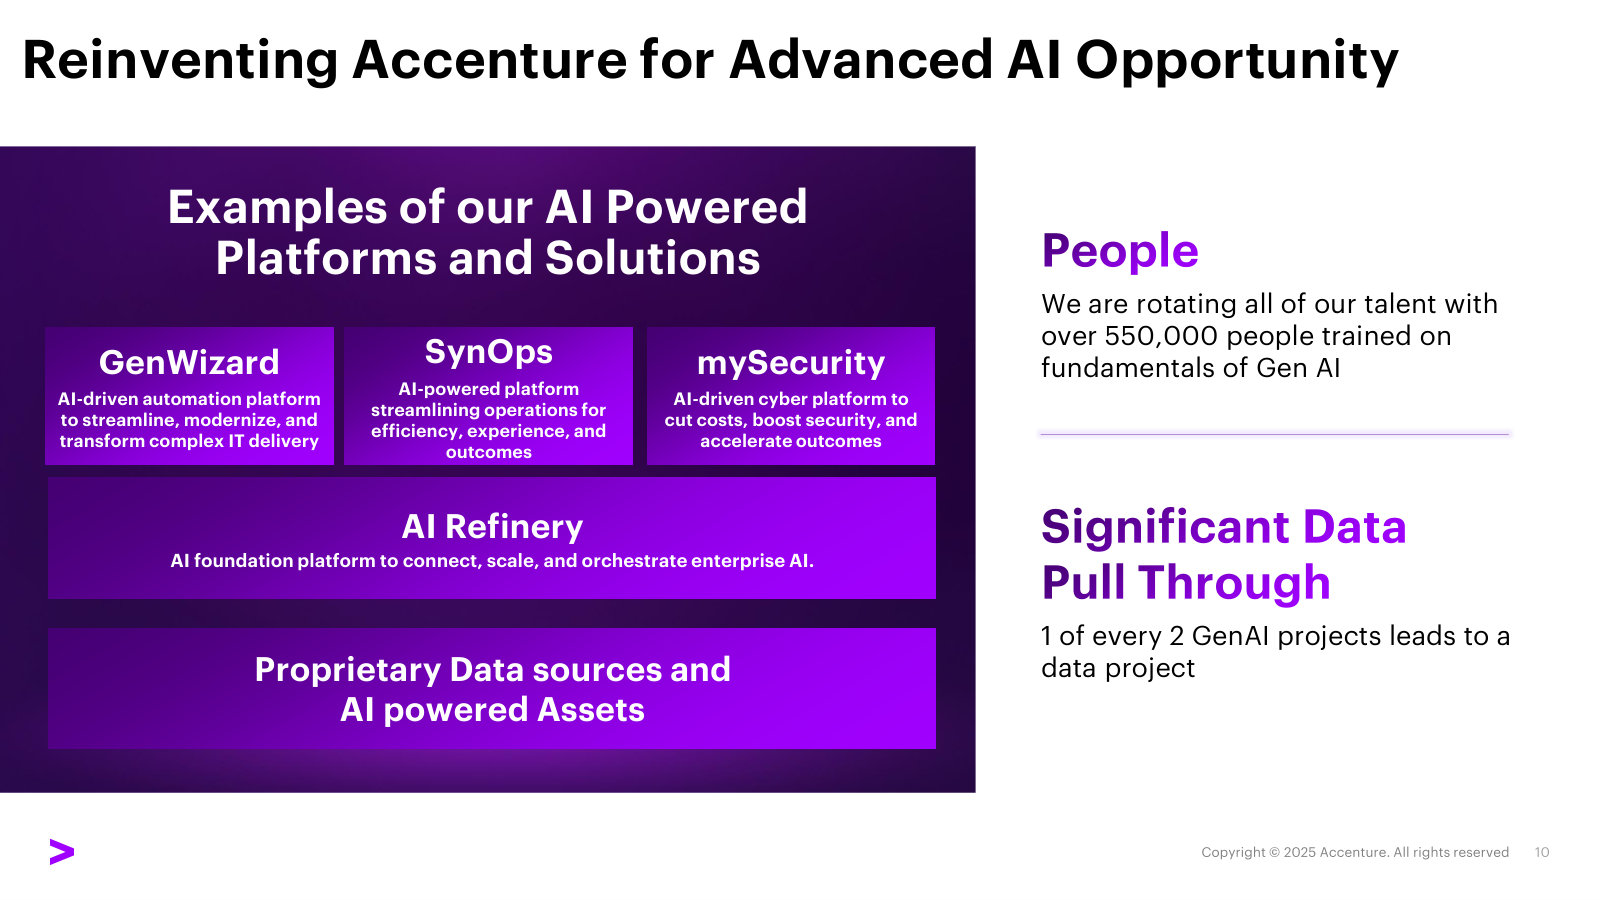
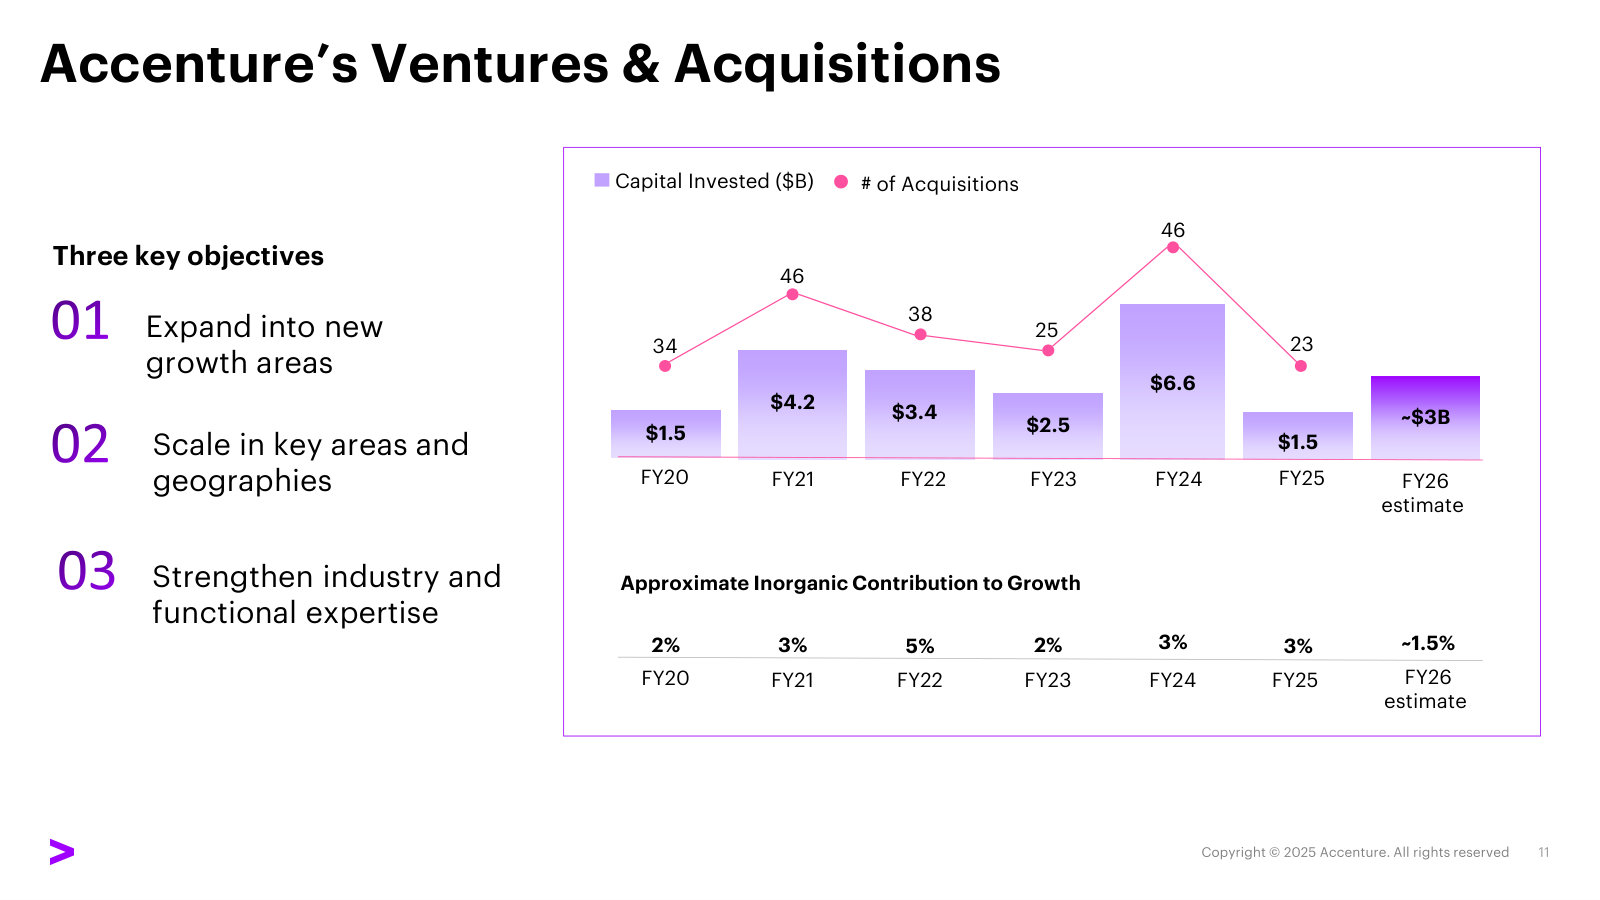
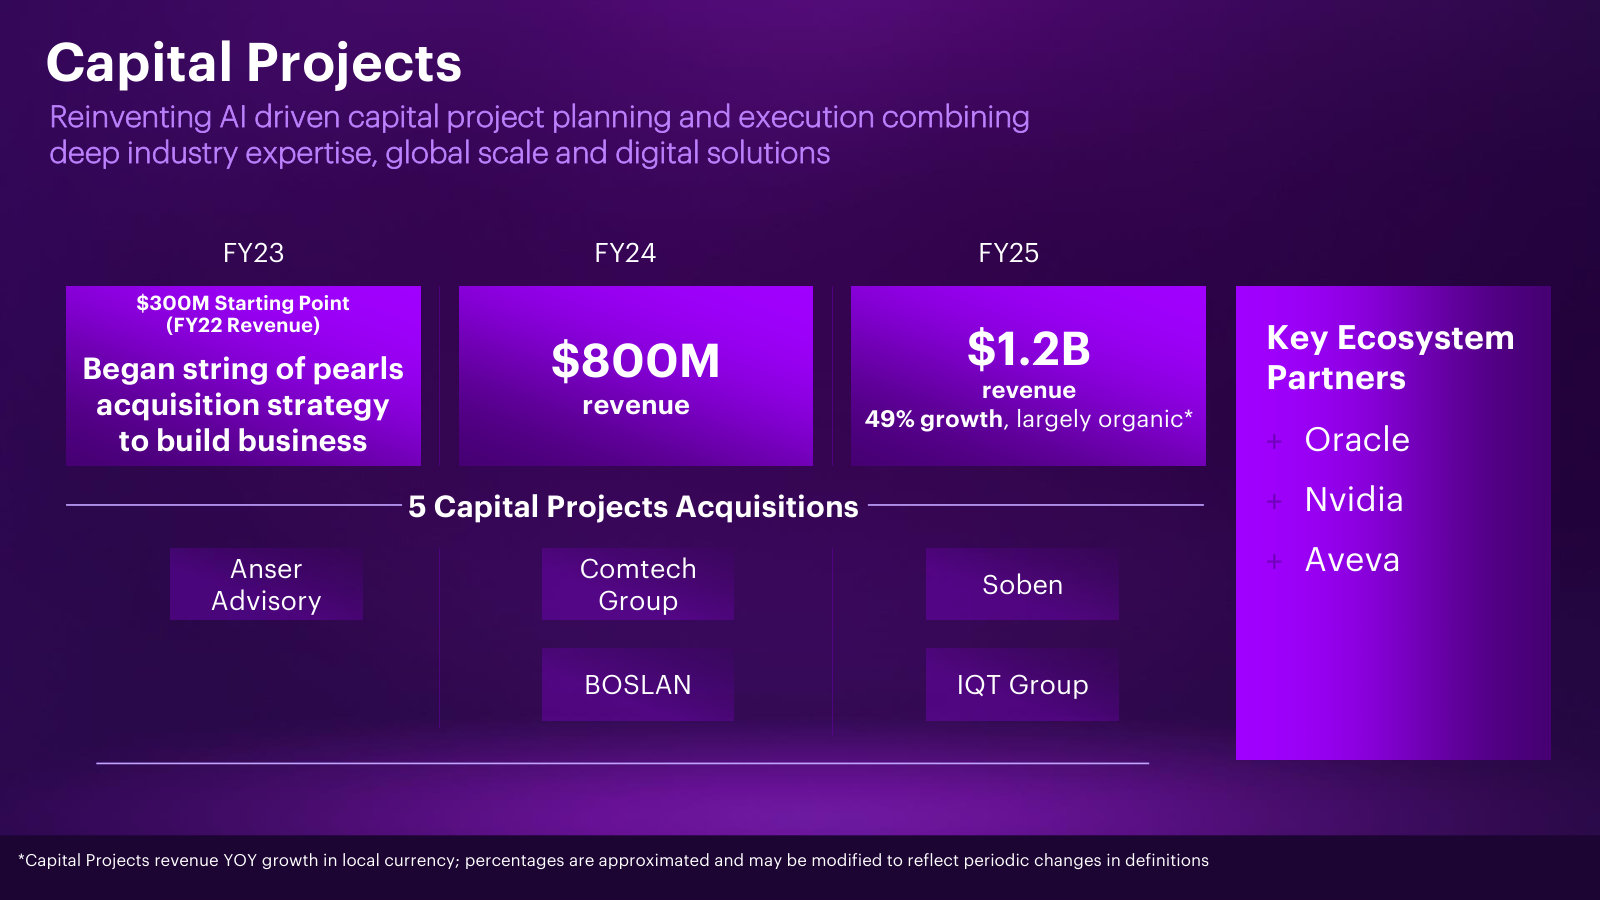
p. 3 — The full FY25 year on one page — $69.7B of revenue by geography and industry, plus the Cloud, Industry X, Security and Song split. · Open the full presentation →p. 4 — Management's scorecard for FY25: guidance met, 129 clients above $100M of quarterly bookings, and where the cash went. · Open the full presentation →p. 9 — AI and data staff, bookings, projects and revenue from FY23 to FY25 — what the $3B investment actually produced. · Open the full presentation →p. 10 — The AI platform stack — GenWizard, SynOps and mySecurity over AI Refinery — and the claim that AI work pulls data work behind it. · Open the full presentation →p. 11 — Capital invested and deal count for each year since FY20, with the inorganic contribution to growth beneath it. · Open the full presentation →p. 13 — Capital Projects built from $300M to $1.2B in three years through five acquisitions — the string-of-pearls method in one chart. · Open the full presentation →
Q4 and Full-Year FY2024 Earnings Presentation — FY2024 · 13 pages · The FY24 full-year scorecard and the return-metric trend from 32% ROIC down to 26% — the baseline current results sit against. · Open →
Q4 and Full-Year FY2023 Earnings Presentation — FY2023 · 11 pages · FY23 results, the year the $3B AI investment began; ROIC still stood at 27% here, against 21% in the latest quarter. · Open →
Investor & Analyst Conference — Leading in the New — FY2015-FY2016 · 12 pages · Management's pre-AI framing of the same model: durable revenue growth, 10-30 bps of annual margin expansion, disciplined capital return. · Open →