Full Report
Fit
Does not fit the framework (P1 not met); contested: P2, P3a
Does not fit the framework. The year-10 durability gate (P1) resolves to not met, and under the framework that gate alone forces the verdict — nothing downstream offsets it. Confidence is medium: the P1 probability spread was 0.22 (at or below the 0.25 medium threshold) and two non-load-bearing criteria (P2 and P3a) came back contested across the two model families. No exclusion fired, the watchlist-only overlay does not apply, and the name-mask probe raised no prior-driven-risk flag. The business clears the universe screen and most of the self-help and yield-context checks; it fails on the one criterion the framework treats as decisive.
Universe and exclusions
The universe screen is clean. Accenture is an Irish-domiciled company whose Class A ordinary shares list directly on the NYSE under ACN — a primary US listing rather than the ADR wording the European route names, but a qualifying listing either way, and not a China-domiciled issuer [1]. Market capitalization at the 2026-07-31 close of $165.92 on 632.4M shares is about $104.93B, roughly 10.5x the $10B universe line and an order of magnitude above it even after the 17.97% single-session drop on 2026-06-18 [2]. Both universe criteria (U1, U2) are met with cross-family agreement.
No exclusion hits. The four disqualifiers were each checked and none fired:
- Auto OEM (X1) — not met. Accenture sells consulting, technology and managed services to more than 9,000 clients; automotive is one of six sub-industries inside the Products segment, not a manufacturing business [3].
- Consensus-saturated story (X4) — not met. The stock trades at about 1.51x FY2025 sales and roughly a 10.4% trailing FCF yield after the June-2026 fall — the opposite of an extreme multiple-to-sales darling; the counter is that forward consensus still embeds ~4–5% annual revenue growth that is largely acquisition-driven [4].
- Promotion pattern (X2) — not met. Insider economic ownership is thin — the whole director-and-officer group holds ~0.02% of shares and the CEO about $0.8M outright against $19.9M realized on vesting in FY2025 alone [5] — and the committee lowered the relative-TSR entry threshold from the 40th to the 30th percentile and swapped a ~16-name peer group for the S&P 500 for Jan-2026 grants [6]. But an X2 hit requires both prongs, and the second — a repeated promise-versus-delivery gap — is not robustly evidenced: the stated shareholder-return dollar floor was met or beaten every year on record and compensation-actually-paid fell from $37.4M (FY2021) to $16.6M (FY2025) as two relative-TSR grants paid 0% [7]. One prong only, so no hit.
- Structural decline (X3) — not met. Revenue rose every year through FY2025 (to $69.67B, +7.4%), with zero consecutive declining years; the drawdown was a price move, not a revenue one. A genuinely structural mechanism exists — the FY2025 annual report names clients' in-house global capability centres as a competitor category with no capital barrier, and HCLTech quantifies 2–3% portfolio-level AI price deflation [8] [9] — but it is so-far forward-looking, not a realized non-mean-reverting loss, so the exclusion does not fire. This mechanism overlaps the diagnosis (P5) trial and the skeptic weakened the strongest version of the claim (see Provenance).
China dependence (S1) is a sensitivity flag only and is immaterial here: the US is 45% of FY2025 revenue, no other single country reaches 10%, and Ireland is ~1%, so any Greater China exposure sits below the 10% line — the caveat being that Accenture does not separately quantify China, so the figure can only be bounded, not pinned [10].
Pattern match
The framework's reader contract carries four recognition setups: cyclicals at the bottom (large banks); a high dividend-plus-FCF yield where the business is not going away; healthcare/insurance forecasting errors that reprice; and quality tech monopolies or duopolies on a fear dip. Accenture most resembles the fourth — a large, high-quality technology-services name sold off on a specific, testable fear (AI disruption of the consulting labour pyramid, plus a federal-procurement slowdown). It also brushes the second, on a ~10.4% unadjusted trailing FCF yield.
But it fits none of the four cleanly, and this framing lines up with the tally rather than against it. The fourth pattern's defining check is a monopoly or duopoly structure; Accenture's own 10-K describes "the markets in which we operate are highly competitive" with no monopoly and no regulatory entry barrier — the fragmented labour-arbitrage structure is exactly what the year-10 gate turns on [11]. The second pattern turns on a high dividend that will not be cut; here the dividend yield is only ~3.6% trailing (~3.9% forward), below the ~4% materiality line, and the framework's own adjusted FCF yield sits well below the bar (below). This is a quality-tech-on-a-fear-dip in silhouette that fails the pattern's moat check.
The pillar ledger
Year-10 durability (P1) — not met · the gate
This is the criterion the verdict turns on, and it split across the model families: the two Claude seats and one Codex seat read it not met, one Codex seat read it met (3 not met / 1 met), trimmed-mean probability 0.62, spread 0.22, cross-family agreement false, masked verdict not met. Genuine doubt on this gate resolves to not met by the framework's own rule.
The supporting record is strong on its face: revenue compounded from $34.8B in FY2016 to $69.7B in FY2025 (+100.2%, ~8.0% CAGR) with no consecutive-decline years and the high-single-digit-decline disqualifier false, on capex of only ~0.86% of revenue and a managed-services book near half of revenue [12] [13]. The strongest surviving counter-fact, carried in the same claim and skeptic-survived: the model rests on human-hour labour arbitrage in a highly competitive, fragmented market with no monopoly structure, management explicitly "does not track standard measures of unit or rate volume," FY2026 local-currency guidance was trimmed (3–5% to 3–4%) and new bookings fell ~1% — so GenAI-driven delivery productivity could compress the revenue base even as it lifts near-term margin [14]. Because the year-10 adjusted-FCF leg cannot be quantified from features (adjusted FCF is not_computable — see Data gaps), the FCF half of the gate rests on disclosed near-zero capital intensity and ~139% net-income-to-FCF conversion rather than a computed series, which is part of why the gate does not clear with very high conviction. Full treatment: The 800,000-Person Payroll and Who Sets the Unit Price.
FCF consistency (P2) — contested
Contested across families: the two Claude seats read it met, the two Codex seats cannot determine (masked verdict met). On raw FCF the series is exceptionally stable — ten years, no negative years, the rolling five-year average climbing monotonically from ~$5.54B (FY2016–20) to ~$9.14B (FY2021–25) and never declining in any window [15]. The counter, and the reason two jurors could not determine: the framework's measure is adjusted FCF (FCF minus SBC minus a trailing-5-year acquisition average), which the deterministic feature returns not_computable because SBC is absent for every year in the data feed; once the ~$2.1B FY2025 SBC and a lumpy ~$3.6B/yr acquisition average (ranging $1.5B FY2025 to $6.6B FY2024) are subtracted, the level roughly halves and inherits acquisition lumpiness the raw line masks [16] [17]. Full treatment: Spending 1.8x Free Cash Flow.
Dislocation and yield (P3) — mixed; P3a contested, yield below bar
Identifiable event (P3a) — contested. Claude seats met, Codex seats not met (2/2). There is a dated adverse mechanism but no clean company trigger: the nearest event to the June-30 trough was the 18-Jun Q3 FY2026 print, an EPS beat ($3.80 vs $3.70) with a slight revenue miss, a Q4 range widened to 1–5% on a ~$100M Middle East impact and two managed-services deals slipping — with management "pleased with how we are executing" [18]. The fall reads as a fear-driven multiple de-rating against roughly-flat fundamentals (consensus EPS held; only price targets were cut) tied to a named mechanism — AI disruption plus federal exposure — which management explicitly rejects, framing AI as "a tailwind for us and our industry as it scales" [19]. The upstream federal slowdown was first disclosed on the Mar-2025 Q2 FY2025 call and is guided to sunset and return to growth in Q4 FY2026 [20] [21].
Capitulation (P3b) — met. Reported as met on the drawdown depth (-38.2% peak-to-trough on the run's price file). The counter is that the capitulation volume multiple was refuted by the skeptic: the feature's 2.36x-vs-2x reference reproduces only against a single pre-peak row on a partial 84-session file and falls to ~1.94x on all available rows, so P3b rests on the price fall rather than a verified 2x volume spike (see Provenance).
Yield vs bar (P3c) — not met. All four seats not met, cross-family agreement. The balance sheet is net cash (~$6.34B: $11.48B cash and equivalents against $5.15B total debt), which sets the fortress reference line at 8.5% [22] [23]. Adjusted FCF yield computes to 4.90% on FY2025 figures (adjusted FCF $5.14B = FCF $10.87B − SBC $2.09B − $3.64B trailing acquisition average, over the $104.93B market cap), about 360 bps below the bar; the three-year-average adjusted yield is 4.02%, about 448 bps below, with no jump toward the bar [24] [25]. The counter-fact, in the same treatment: on an unadjusted basis FCF yield is ~10.4% and clears the bar — the entire shortfall is the SBC and the near-$3.6B/yr acquisition drag the definition mandates.
Forward path (P3d) — not met. All four seats not met, trimmed-mean probability 0.245, spread 0.08. The consensus_forward_yield anchor shows street FCF yield rising from 10.68% (FY2026) to 12.15% (FY2029), above the 8.5% bar — but that anchor is unadjusted; re-deriving it on the playbook definition (subtracting ~$2.2B SBC and a trailing acquisition average that FY2026's guided ~$9B in ventures and acquisitions pushes toward ~$4.6B) pulls the adjusted forward yield to only ~4.2%, so consensus does not underwrite the adjusted bar within three years [26]. Full treatment: Priced at $165.92.
Balance sheet and self-help (P4) — met across the board
All three self-help criteria are met with cross-family agreement.
Outlast and allocation headroom (P4a) — met. The balance sheet is net cash (~$6.33B) with covenant-free senior notes laddered 2027–2034, so no refinancing wall forces debt paydown ahead of buybacks [27] [28]. Counter-fact: FY2026 is the first year the company plans to spend well above one year's cash — the skeptic weakened the claim's ~1.8x figure to at least 1.66x of the $11.15B guided FCF midpoint (~$18.5B of M&A plus shareholder returns), with cash drawn from $11.5B to $10.2B over nine months and a second debt raise flagged [29]. Headroom is being consumed by choice, not distress.
Repurchase engine (P4b) — met, no hard fail. Diluted share count fell from 645.91M (FY2021) to 632.44M (FY2025), −2.1% (feature share_count_trend.rising = false), so the rising-share-count hard fail does not trip; FY2025 executed purchases were $4,619M [30]. Counter-fact: the base shrank only 2.1% despite $21.3B of gross purchases because ~$8.97B of SBC and employee-plan issuance ran the other way, and $776M of the FY2025 outlay was tax-withholding that does not reduce authorization — so the buyback functions largely as a dilution offset [31] [32].
Dividend cover (P4c) — met. The dividend (~3.6% trailing / ~3.9% forward, just under the ~4% materiality line) is covered ~2.9x by FY2025 FCF and ~47% of net income, raised ~10% a year on an unbroken record [33]. Counter: the FY2025 FCF anchor was lifted ~65% by a $1,519M non-recurring accrued-payroll swing that management guides back toward 1.2x conversion, so normalized cover is thinner though still above 1x. Full treatment: Spending 1.8x Free Cash Flow.
Diagnosis (P5) — met; carried from the adversarial trial
P5 is met, on a trial-ruled probability that the impairment is temporary of 0.63 (mean 0.613, inter-judge spread 0.07, not contested; three judges at 0.64 / 0.57 / 0.63). The temporal signature is split: the federal drag (~8% of revenue, ~1pt FY2026 growth drag) is procurement-driven and management guides it to anniversary and return to growth in Q4 FY2026 — clearly temporary [34] [35]. Against it sits AI price deflation on a fixed-price book that is over 60% and rising — a candidate-permanent erosion with no comparably sized cost pool to absorb a client-side concession [36]. The strongest counter to the temporary read, carried in the same treatment: the permanent leg is unmeasured — management cannot separate price from volume and does not disclose the fixed-price book's duration — and the trial's own quote-check caught the temporary side overstating that management "raised FCF guidance," when FY2026 FCF was held flat at $10.8–11.5B and it was capital return, not FCF, that was raised [37]. A 0.63 temporary reading is above coin-flip but well short of the ~0.65–0.70 the framework's tiered fit thresholds ask for. Full treatment: Priced at $165.92.
Instrument context (I1) — not verifiable
All four seats returned not verifiable. Listed ACN LEAPS beyond the 18-month target do appear to exist (a Jan-2028 and a Dec-2028 expiry alongside a 2027 chain) and 30-day implied volatility of ~52.4% would sit within the ~55 acceptable reference line — but both readings come only from external option-chain and volatility URLs the corpus phase cannot verify, and no dated citable local source exists (see Data gaps). Because I1 is fact-only and never blocks the pillar verdicts, this does not change the outcome; it would have driven the watchlist overlay only had the verdict been fits or lean_fit, which it is not.
What a 3x-in-3-years would require
The tally records no re-rating arithmetic: "Re-rating math unavailable because the applicable bar or normalized adjusted FCF is missing." The applicable bar is 8.5% (fortress) and adjusted FCF is not_computable from features, so the deterministic price-at-bar figure the framework would normally publish is absent.
What can be stated, from the surviving yield claims rather than the tally: at the FY2025 adjusted FCF of $5.14B, the market cap consistent with the 8.5% bar is $5.14B ÷ 0.085 ≈ $60.5B — about 42% below the current $104.93B ($165.92/share) — so on today's adjusted cash flow the framework's yield bar is cleared by price falling, not rising. To instead clear the bar at the current market cap, adjusted FCF would have to reach ~$8.92B (from $5.14B), which needs the ~$3.6B/yr acquisition drag to fall toward zero while FCF holds near $11B — the opposite of the raised FY2026 ~$9B acquisition guidance. Consensus underwrites neither path on the adjusted definition. The episodic base-rate context the framework draws from prior dislocation recoveries is not computed in this run (the tally's re_rating_math is null); the valuation treatment is in Priced at $165.92.
Contested and undetermined
Two criteria were contested; nothing was returned as cannot-determine.
- P2 (FCF consistency) — contested. Claude seats met on the stable raw-FCF series; Codex seats could not determine because the framework's adjusted-FCF measure is not_computable (SBC absent for every year). Both readings rest on the same fact — raw FCF is stable, adjusted FCF cannot be built deterministically.
- P3a (identifiable event) — contested. Claude seats met (a dated, named macro-fear mechanism — AI plus federal — with a fear-driven de-rating against flat fundamentals); Codex seats not met (the nearest dated company event was an EPS beat, not a guidance or earnings cut of the size the fall implies).
Provenance
| Item | Value |
|---|---|
| Jury seats | a = claude, b = claude, c = codex, d = codex; masked = claude |
| Families | claude, codex (2 seats each) |
| Trial (P5) order stability | temporary-first mean 0.64, permanent-first mean 0.60, gap 0.04 |
| Name-mask probe | gate criteria differ: none; max probability gap 0.075; prior_driven_risk: false |
| Skeptic protocol (full) | 20 claims taken to full protocol — survived 10, weakened 7, refuted 1, unverifiable 2 |
| Skeptic triage | 18 further claims passed cheap triage (38 claims seen in total) |
Source: derived from the run's fit tally, jury dockets and refutations ledger.
The verdict was pressed hard. Two independent model families each held two seats and reached the same gate call on P1 (not met) and the same masked-name outcome, with no gate flip when the company name was masked and only a 0.075 probability gap — so the answer is not an artifact of model priors. One claim was outright refuted (the capitulation volume multiple, which failed to reproduce off the partial price file) and seven were weakened rather than accepted as written, which is why several supporting figures here carry the skeptic's trimmed version rather than the pillar author's original.
The falsifier ledger
These are the standing what-would-change-this conditions carried from the tally; thresholds, directions and test windows are stated where the framework defines them.
Framework templates:
- adjusted FCF or EBITDA declines where flat-or-better was underwritten
- revenue declines for a third consecutive year
- capital allocation pivots to debt paydown over repurchases
- share count inflects upward
- the industry repricing cycle fails to materialize where industry-wide mean reversion was underwritten
Name-specific conditions:
- Bookings/book-to-bill stay below 1.0 for 2+ consecutive quarters with the >=$100M deal count falling YoY (next test Q4 FY26).
- ACN's own price realization / revenue-per-unit visibly declines, or peers' 2-3% AI deflation shows through in ACN organic pricing at renewal.
- Consensus forward FCF ($11-13B FY26-FY29) is cut materially rather than held/raised.
- Federal fails to return to growth in Q4 or ex-federal organic LC growth turns negative, showing the shock spread beyond the 8% pool.
- Two consecutive quarters of book-to-bill below 1.0 with $100M-plus client bookings down year over year.
- FY2027 organic local-currency growth excluding acquisitions and federal anniversary effects is guided below 2% or revised down after Q1.
- Disclosed or peer-implied AI price/revenue-per-delivery-unit deflation exceeds productivity capture and drives margin compression.
- AFS does not return to growth in Q4 FY2026 and further price/scope cuts or terminations persist through FY2027.
- Bookings/book-to-bill roll over for 2+ quarters with the $100M-deal count declining YoY, showing demand (not just federal) is breaking.
- Organic growth ex-federal AND ex-inorganic (i.e., stripping the ~1.5-2% acquisition contribution) stalls near or below zero, exposing bought growth masking a dead legacy engine.
- Price realization/margin compresses as peers' 2-3% AI deflation shows up in Accenture's numbers, rather than being captured as productivity (margin already +20bps argues against this today).
- Consensus/managed forward FCF is cut materially instead of held or raised.
Data gaps
What the run could not answer, from the tally's list:
- Adjusted FCF and adjusted FCF yield are not_computable in features.json (SBC missing for FY2016–FY2025 and no complete 5-year acquisition window), so the year-10 adjusted-FCF leg of P1 cannot be quantified from features; the FCF-leg durability case rests on disclosed near-zero capital intensity and ~139% net-income-to-FCF conversion rather than a computed adjusted-FCF series.
- Accenture does not separately disclose a Greater China revenue or asset figure, so S1 China exposure can only be bounded below 10%, not quantified exactly.
- balance_sheet_class is 'unknown' (debt/cash missing for FY2025 in the feed), so no leverage-based durability cross-check is available from features; the fortress classification was reconstructed from the filed 10-K (cash $11,478.7M, total debt $5,148.7M → net cash +$6.33B).
- The features engine recorded acq_5y_avg as 0.0 for FY2020–2025, contradicting the primary filings' $1.5B–$6.6B of annual business acquisitions; any downstream use of that field would overstate adjusted FCF.
- X3 realization: no third-party market-share or price/realization series for Accenture exists in the corpus, and the company does not disclose the duration profile of its >60% fixed-price book, so the timing and magnitude of any AI-driven repricing cannot be confirmed or refuted in Accenture's own realized numbers.
- Terminal growth — the decisive input splitting temporary from permanent — is unmeasured: the corpus carries no third-party organic-growth or Accenture-specific AI-price-deflation series, so the permanent-case FCF haircut is an assumption band, not a measured value.
- Price history is partial: the run's price file holds only 84 sessions (2026-04-01 to 2026-07-31), so the peak used by the capitulation gauge is a four-month high ($201.33), not a true multi-year peak; the 52-week high $291.09 and the −43.0% damage figure are sourced from the estimates feed, and the 2.36x volume multiple was refuted against this partial file.
- I1 liquidity: per-contract open interest and bid/ask spreads for the qualifying ACN 2027/2028 LEAPS, and a dated implied-volatility reading, could not be obtained from a citable local source (corpus/web-search credit was exhausted mid-pass); liquidity and IV adequacy are inferred, not measured.
- No published target leverage ratio: management commits only qualitatively to "a low net leverage ratio," so the ceiling on FY2026 debt-funded buybacks/M&A is not quantified.
- The X2 promise-versus-delivery prong is not robustly evidenced: the shareholder-return dollar floor was met or beaten every year on record, so the exclusion's second prong rests only on comp-design resets, not a documented pattern of guided-then-missed results.
Checked and unremarkable
No scout memo returned a routine or empty verdict — all eight (accounting and cash quality, business economics, capital allocation, competition and moat, history and track record, industry, people and governance, valuation and expectations) were load-bearing and their evidence is threaded into the pillar treatments above.
Playbook version
Framework: fcf-dislocation, version 4 (spec fit-spec version 2), as frozen for this run.
The 800,000-Person Payroll
Accenture is one of the largest companies in the world that owns almost nothing. In the fiscal year ended 31 August 2025 it booked $69.7 billion of revenue, employed approximately 779,000 people, and served roughly 9,000 clients — three-quarters of the Fortune Global 100 and 500 — from an Irish domicile, with its Class A shares listed on the New York Stock Exchange [1]. To produce all of that, it carried $1.57 billion of net property and equipment [2] — roughly one dollar of fixed plant for every forty-four dollars of sales. There is no factory here, no fleet, no store network, no reserve base. What Accenture sells is the time of its people, organized around a client list, and everything else about the business follows from that single fact.
That makes it an unusually clean company to learn, because there is only one thing to understand. This chapter draws the map: what the enterprise physically is, what its people do and for whom, the shelf of rivals it competes against, and why — after a decade of quiet reliability — it arrived in front of investors this summer with the steepest single-session share decline in its recent history.
FY2025 Revenue
People (approx.)
Net Property and Equipment
Capex / Revenue
Sources: FY2025 Annual Report (Form 10-K), Item 1 Business [3] and Note 16 Segment Reporting [4]; capex-to-revenue derived from reported cash flows.
A company that is mostly a payroll
The whole cost structure fits on one line. In its FY2025 segment note, Accenture reconciles revenue to operating income with only three recurring cost categories: payroll of $45.7 billion, non-payroll costs including subcontractors of $11.6 billion, and depreciation and amortization of $1.5 billion [5]. Payroll alone is 65.6% of revenue and 76.8% of total operating expense. The company says as much in plain words: cost of services "is primarily driven by the cost of people serving our clients" [6].
Source: FY2025 Annual Report (Form 10-K), Note 16 Segment Reporting [7].
Read across the three years, the striking feature is how little the ratios move. Payroll has sat at roughly 65-67% of revenue and the other cost lines within a point of themselves, while the operating margin has held near 14-15%. A business with a factory would show operating leverage — fixed costs spread over more units as volume grows. Accenture shows almost none, because its costs are not fixed. They are people, hired and paid roughly in proportion to the work, so the model is less about spreading a cost base than about holding a set of ratios steady while the whole thing scales. Managing this company means managing the gap between what it charges for an hour and what that hour costs.
The other side of "owns almost nothing" is that growth needs almost no capital. Capital expenditure has fallen from about 1.4% of revenue a decade ago to 0.9% in FY2025, and net property and equipment barely changed — $1.53 billion in FY2023, $1.57 billion in FY2025 — while revenue grew 8.7% over the same span [8]. Asia Pacific alone produced $10.0 billion of revenue on $239 million of segment net assets.
Source: derived from reported cash flows, FY2016–FY2025 10-Ks.
The practical consequence is that nothing on the asset side constrains how fast Accenture can grow, and nothing on the asset side is where its money goes. When the company wants to add a capability, it does not build a plant; it hires, or it buys a firm. That is why the reinvestment story, when it comes, is a story about acquisitions and payroll rather than capital spending — a thread the later chapters pick up.
What the people do, and for whom
Accenture organizes the same pool of people two ways. By type of work, it splits into Consulting — advising, designing and building, recognized as the work is delivered — and Managed Services, where it runs a client's process or system on an ongoing basis under multi-year contracts. In FY2025 the two were almost exactly even at $35.1 billion and $34.6 billion, a deliberate drift toward the annuity half of the book from a consulting-weighted mix a few years earlier [9].
By industry group, the same people are pointed at five end-markets. Products — consumer goods, retail, industrial, travel and life sciences — is the largest at $21.2 billion, followed by Health and Public Service, Financial Services, Communications, Media and Technology, and Resources [10].
Source: FY2025 Annual Report (Form 10-K), Note 16 Segment Reporting [11].
Geographically the business runs through three reportable markets — the Americas at 50% of revenue, EMEA at 35%, and Asia Pacific at 14% [12]. Country concentration is milder than the geography split suggests: the United States was 45% of consolidated revenue in each of FY2023, FY2024 and FY2025, and no other country reached 10% [13]. This breadth — five industries, three regions, one large but sub-majority country — is the reason no single vertical shock moves the whole company, and it is the first thing that separates Accenture from a specialist.
There is one exception the company itself carves out. Its U.S. federal work runs through Accenture Federal Services, which represented about 8% of total revenue in FY2025 — but 36% of Health and Public Service and 15% of the Americas [14]. This is the one demand block whose budget is set by government procurement rather than by client spending, and in fiscal 2026 it has behaved differently from the rest. Management has attributed roughly one point of the year's revenue-growth shortfall to the federal business in every quarter — enough that it now guides the whole company two ways: 3-4% local-currency growth including federal, or 4-5% excluding an estimated one-point federal drag [15]. One 8%-of-revenue relationship has, for four straight quarters, been worth a full point of company growth.
A last feature to hold in mind: because revenue is billed hours, it swings with the calendar. Quarterly gross margin moves several points across a year on billable days and holidays alone, so any single quarter has to be read against the annual run-rate rather than the one before it.
The shelf it competes on
Accenture is the largest single revenue pool in its industry by a wide margin. Its $69.7 billion dwarfs the businesses usually named alongside it: IBM's Consulting segment at $21.1 billion and Cognizant at $21.1 billion are each about 30% of Accenture's scale [16] [17].
Sources: Accenture FY2025 10-K [18]; IBM Consulting segment [19]; Cognizant FY2025 10-K [20].
Scale, though, is not the same as a fortress, and the reason is structural. What makes this industry unusual is that its barrier to entry is not capital. When Accenture lists its competitors, it names an entire ecosystem: large multinational IT-service providers, the services arms of technology vendors, offshore providers "particularly in India," accounting firms and consultancies, advertising holding companies, engineering-services firms, technology start-ups — and, tellingly, "in-house IT departments of large corporations that use their own resources rather than engage an outside firm, such as global capability centers" [21]. The company adds that clients "typically retain us on a non-exclusive basis." Two things follow. First, one of the named competitors is the client itself: a global capability center is a captive offshore unit a company builds instead of buying the service. Second, the competitor set is not Accenture's own framing. Cognizant's 10-K opens its direct-competitor list with Accenture and separately flags in-house resources "such as GCCs"; IBM's 10-K names Accenture, Capgemini and India-based providers as its consulting competitors [22]. Three independent filers describe the same crowded field, and nothing physical stops entry into it.
What the incumbents claim instead is a barrier made of relationships and breadth. Accenture has partnered with 195 of its top 200 clients for ten years or more, counts 305 of them as "Diamond" clients, and is the number-one partner to all ten of its largest technology-ecosystem partners [23]. Whether that incumbency is a genuine moat or simply a good position in a competitive industry is a question the next chapter takes up; for now it is enough to see that the defense is a client list, not a cost curve.
And the whole shelf is planning for a slow year. Every named competitor, and Accenture itself, is guiding low-single-digit constant-currency growth for the year ahead — even as the third-party market they draw from is described as growing faster. TCS's annual report, citing Gartner, puts IT services on track to grow 6.8% and surpass $1.87 trillion in 2026; Infosys cites IT services growing 4.6% in calendar 2025 [24] [25]. The vendors themselves plan for less.
Sources: Accenture Q3 FY2026 release [26]; IBM Q2 FY2026 call [27]; Infosys Q1 FY2027 call [28]; HCLTech Q4 FY2026 call [29]; TCS FY2026 as reported.
That the market pool grows mid-single-digit while every large vendor guides low-single-digit — and TCS's own constant-currency revenue fell in FY2026 — is the industry's central unresolved arithmetic. Either spending is flowing somewhere other than the named vendors, or the price of the work is falling faster than the volume is rising. Either way, the growth Accenture reports has to be read against a shelf where the base rate is now roughly flat to slightly up.
Why this is a story now
For most of the last decade, Accenture was the sort of company investors bought precisely because it did not surprise them. That changed in one session. On 18 June 2026 the company reported its fiscal third quarter — and the shares fell 17.97% that day, from $156.01 to $127.98, on about eight times their normal trading volume. It was the steepest single-day decline in the price record available for the company.
What makes the reaction worth an entire report is that the report behind it was, on its face, fine. Accenture beat consensus earnings, held its free-cash-flow guidance and raised its capital-return plan to at least $9.5 billion; the only guidance line it cut was the top of its local-currency revenue range, from 3-5% to 3-4% [30]. What appeared to trouble the market sat lower in the release: new bookings of $19.32 billion, down 3% in local currency, at a book-to-bill of 1.0 — the order book, not the current quarter [31]. The arithmetic of that repricing, and what the recovered price now embeds, is the closing chapter's subject. The point here is only that the market stopped treating this company as reliable, and did so over the durability of demand rather than the level of this year's earnings.
The reason a single soft bookings line could do that is everything the map has just shown. This is not a business with many independent variables. It is a headcount pyramid and a client list: $69.7 billion of revenue produced by about 800,000 people and $1.57 billion of property, in an industry with no capital barrier, at the moment its own peers are quantifying how much cheaper artificial intelligence is about to make the work. And it sits at the center of the report's organizing question. Accenture states in its own 10-K that it cannot measure how much of its revenue growth is price versus volume — the disclosure does not contain the variable that matters most — precisely as named rivals put numbers on AI-driven price deflation in the same book of work. Around that unmeasured core sits a decade-old promise to expand margin ten to thirty basis points a year, kept every year in the company's adjusted presentation but not in its statutory one, on which management is graded and paid; and a fiscal-2026 plan that commits roughly 1.8 times free cash flow to buying growth and buying back stock at the same time. Each of those is a later chapter.
These threads are not separate. Because the entire enterprise is the price and cost of an hour of labour, each one comes back to that same hour — what it sells for, what it costs to produce, and how long the price can hold. That contest — who actually sets the price of the unit of work, and what happens to it as the technology Accenture sells makes the unit cheaper to make — is where the story goes next.
Who Sets the Unit Price
The payroll-heavy income statement the reader now holds turns on the price of an hour of Accenture's labour, and whether it holds while the technology the company sells makes that hour cheaper to produce. A reader would reach, reflexively, for the instrument that measures it — a rate card, a realization index, a price-versus-volume split. Accenture states in its own 10-K that it does not have one.
The instrument the company says it lacks
In the section of the FY2025 Form 10-K where a manufacturer would decompose revenue into price and units, Accenture writes the opposite: "we cannot measure how much of our revenue growth in a particular period is attributable to changes in price or volume. Management does not track standard measures of unit or rate volume." [1] Each contract is a customized mix of services, the filing explains, so no standard comparability measure applies. The single most important operating variable in a labour business is, by management's own account, unobservable from the outside.
The word the company does use — "pricing" — is not a price. Asked on the Q2 FY2025 call whether the pricing environment was stabilizing, the CFO answered and then defined the term: "pricing is the contract profitability or margin on the work that we sell." [2] That reframes the entire disclosed pricing arc. When the same analyst noted that "I looked back the last seven quarters, you called pricing as being down a bit," [3] and management later described pricing improving through Q3 FY2025 and into FY2026, both were talking about contract margin, not the rate charged per unit of work. The seven-quarters-down-then-recovering series that reads like a price index is a margin commentary. There is no rate series, no realization figure, no win-rate and no churn rate anywhere in the covered filings and calls. The absence is not a gap in this chapter; it is the chapter's subject.
Two proxies, both against a ceiling
With the direct instrument gone, two proxies remain, and both are pinned. The first is volume, for which the only observable series is headcount. In FY2025 revenue grew 7.4% while the year-end workforce grew about 0.6%, from roughly 774,000 to approximately 779,000 people [4], and payroll cost grew 7.3%, from $42,582M to $45,679M [5]. The revenue did not come from more people; it came from more value per person. But the variable that captures value per person is precisely the one management says it does not track.
Source: revenue and headcount from the FY2025 Form 10-K, Item 1 Business [6]; payroll cost from Note 16 [7].
The second proxy is utilization — how fully the people already on the roster are billed. It has run in a narrow band, 91% to 93% across FY2021–FY2025, and management has closed the door on it as a hidden lever. Asked directly on the Q4 FY2025 call whether internal AI would lift utilization structurally, the CEO said the company would "continue to move around in the low-90s. So we don't have a structural change in utilization due to AI." [8] A workforce billed in the low-90s cannot be billed much harder. So neither proxy is free to move: headcount grew less than one point in a seven-point revenue year, and utilization is against its ceiling. There is no third lever hiding behind the missing instrument. The only price series the company publishes is the operating margin itself — expanded in tens of basis points a year, a figure whose machinery belongs to the next act (Ten to Thirty Basis Points).
What the rivals are counting
The instrument Accenture says it lacks is one its named competitors have started to build and quantify. Cognizant's CEO described the change in the pricing basis in mechanical detail: "unlike in the past, where pricing was determined by the unit price, which is billing equivalent, the race now is about the number of units and how well you can deliver with a lower number of units for the same output… 40% of our software development cycle is assisted by AI. We have infused AI into our rate cards." [9] The unit of sale is migrating from an hour to an outcome, and AI-driven productivity is being priced into the rate card as it happens.
HCLTech went further and put a number on the deflation, then cut its own guidance for it. On its Q4 FY2026 call management said "the 3% to 5% deflation that I mentioned in the AI disrupted services… it would translate to 2% to 3% for our portfolio," added that "very little has really played out in already reported numbers," and guided FY27 revenue growth to "1% to 4% in constant currency" partly on that basis. [10] Set that against Accenture's framing of the same technology in the same twelve months: "We believe that AI will be a tailwind for us and our industry as it scales." [11] One management team names a percentage and lowers its plan; the other names a direction. Neither is provably wrong — but only one of them has published the number.
Whether that industry-wide deflation reaches Accenture's revenue depends on the form of its contracts, and here the company is more exposed than the rivals it out-scales. More than 60% of its work is fixed-price, a share that "continues to increase over 60% in FY25." [12] Under a fixed-price contract, a delivery-productivity gain accrues to Accenture as margin until the contract is renewed; under a rate-card contract it is passed through to the client at repricing. The 60%-fixed book is therefore a shelter for as long as the contracts run and a repricing event when they turn over — and Accenture discloses the share of fixed-price work but not its duration, so the moment the shelter lapses is not observable either. This is the live uncertainty the report will return to at the close: how much of the peer-quantified deflation reaches this particular book, and when.
Sources: Accenture FY2025 10-K [13] and Q2 FY2025 call [14]; Cognizant Q1 FY2026 call [15]; HCLTech Q4 FY2026 call [16]; TCS Q4 FY2026 call [17].
When the client becomes the competitor
The same pressure arrives through a second door, and this one Accenture and a peer describe independently. The FY2025 10-K's competition section lists, among the firms it competes with, "in-house IT departments of large corporations that use their own resources rather than engage an outside firm," naming global capability centres — client-owned offshore delivery units — as a competitor category. [18] Cognizant's 10-K frames the same category more sharply, as GCCs "which may provide a lower cost alternative to our services." [19] Infosys' FY2025 risk register books it as a quantifiable leak, warning that client GCC formation "may result in loss of addressable market share." [20] When the buyer can stand up its own delivery centre, the vendor's substitute is the customer itself.
Nothing in the contract form slows that substitution. The majority of Accenture's contracts, the 10-K notes, "are terminable by the client on short notice with little or no termination penalties, and some without notice." [21] The paperwork does not lock the client in. Whatever holds the relationship together, it is not a switching penalty written into the contract.
What holds the accounts
What does hold it is incumbency, and the evidence for it is specific and numeric rather than asserted. Accenture serves roughly 9,000 clients and reports it has "partnered with 195 of our top 200 clients for 10 or more years, and have 305 Diamond clients, our largest client relationships." [22] In FY2025 it booked a record 129 quarterly engagements above $100 million. [23] Decade-plus tenure across almost the entire top 200, and a rising count of nine-figure deals, is the strongest cited evidence that the largest reinvention work is won on the strength of the relationship, not the price of the hour.
The second protective asset is position in the technology ecosystem. Accenture reports it is "the number-one partner for all of our top 10 ecosystem partners," and that "60% of our revenue in fiscal 2025 was driven by work that we do with these partners, which grew 9%" — outpacing the company's own 7% growth. [24] That is a privileged place at the front of the queue when a hyperscaler or software vendor needs an implementation partner. It is also a concentration: well over half the revenue base is tied to the go-to-market choices of ten technology companies, so the asset and the exposure are the same fact read from two sides.
The distinction that matters is between the relationship and the revenue inside it. Incumbency and ecosystem rank protect the account — they keep Accenture in the room for the next transformation. They do not, on their own, protect the price of the work once that work can be delivered with fewer units, because the contract can be repriced at renewal even though the client never leaves. Stickiness of the relationship and durability of the unit price are two different questions, and the hard evidence answers only the first.
The soft spots in the outgrowth
Over five years the outgrowth is real and large. Accenture compounded revenue from $50.53B in FY2021 to $69.67B in FY2025, up 37.9% — well ahead of Cognizant's 14.0% over the same window, Capgemini's 23.7% and IBM Consulting's near-flat 0.8%.
Cumulative revenue growth: Accenture and Cognizant FY2021–FY2025 in USD; Capgemini CY2021–2025 in euros; IBM Consulting is the segment over the shorter FY2023–FY2025 window — the windows and currencies are not identical. Accenture's FY2025 revenue and 7% growth are as reported [25]; peer figures as reported in each company's annual filings.
Two things soften the share-gain story management tells on top of that record. The first is that the "market share" it claims is scored against a yardstick it defines itself. Management says it takes share "on a rolling four quarter basis against our basket of our closest global publicly traded competitors, which is how we calculate market share" [26] — a basket it elsewhere describes as "roughly two dozen of our closest global public competitors, which represents about a third of our addressable market." [27] That basket excludes the private Big Four and Deloitte, and excludes the client GCCs Accenture's own 10-K names as competitors, and no third-party share estimate appears anywhere in the corpus to test it. In FY2025 the company said it "took market share at more than five times our investable basket." [28] Over the same window Infosys reported "increased market share gains" [29], Cognizant said "we are gaining market share" [30], and TCS cited "market share gains" [31]. Four firms cannot all be taking share from one another; against a self-defined denominator, "gaining share" can be true for everyone and decisive for no one.
The second soft spot is that a material slice of the growth was bought rather than won. Management quantifies the inorganic contribution each year, and the arithmetic in FY2024 is the telling one: the company guided FY2024 to "1.5% to 2.5% growth in local currency… which assumes an inorganic contribution approaching 3%." [32] When the acquired contribution runs close to 3 points and the whole company grows about 2 points, the organic line went slightly backwards — the share Accenture reported taking that year was funded, not generated. FY2025 was healthier: of roughly 7 points of local-currency growth, "a bit more than 3%" was inorganic [33], leaving about 4 points organic. Management expects about 1.5% inorganic in FY2026 [34] and to enter FY2027 "slightly under at 2% of inorganic contribution." [35]
In FY2024 the acquired contribution (about 3 points) exceeded total local-currency growth (about 2 points), so organic growth was slightly negative. Source: Q3 FY2024 call [36], Q2 FY2025 call [37], Q3 FY2026 call [38]; FY2026 total is the midpoint of the guided 3–4% range.
A quieter tell sits underneath. The company's own count of its deepest relationships, the Diamond clients, climbed every year — 229, then 267, 300, and 310 at the end of FY2024 [39] — and then edged down to 305 in FY2025 [40], the first decline in the series, in a year revenue grew 7%. The metric then disappears: it is reported in none of the three FY2026 quarterly calls in the corpus. Full-year bookings slipped about 1%, and Q3 FY2026 bookings fell 3% in local currency at a book-to-bill of 1.0 [41] — the forward order book flat-to-down while the reported revenue line grew. The deepest-relationship indicator stopped compounding at exactly the point the company stopped publishing it.
What protects the relationship, and what does not
The contest over the unit price divides cleanly. On one side is what genuinely protects Accenture: decade-long incumbency across nearly the whole top 200, and rank as first-choice partner to the ten technology vendors that pull 60% of its revenue — both real, both numeric, both hardening on the disclosed evidence. On the other side is what does not: a market-share metric the company scores against a basket it draws itself, and a unit price it states it cannot measure, at the moment named rivals are quantifying that price falling 2–3% a year in the same book of work. Incumbency keeps Accenture in the account; it does not, by itself, keep the price of the hour inside the account from being renegotiated once the hour takes fewer people to deliver.
That leaves the one series the company actually publishes as the readout of price — the operating margin, which it has expanded in tens of basis points a year on the strength of exactly the fixed-price, productivity-retaining book described here. How that margin is held, what has been carried outside it to keep the promise intact, and how far the graded number has drifted from the statutory one, is the account that follows.
Ten to Thirty Basis Points
The one number the company publishes about its own price
The prior act (Who Sets the Unit Price) ended on an absence: Accenture states it cannot measure how much of its growth is price and how much is volume, so the only price series the company actually publishes about its own work is the operating margin. This chapter reads that series closely, because management has made the same promise about it, in almost the same words, for a decade.
The promise has four parts. The oldest investor document in the corpus — a fiscal-2016 conference deck — set them out as durable revenue growth, sustainable margin expansion of ten to thirty basis points a year, strong free cash flow, and a minimum dollar return to shareholders. The fiscal-2026 outlook uses the identical frame: the same band, the same "minimum" construction. Two of those four promises belong to the chapter that follows on capital (Spending 1.8x Free Cash Flow) — the return floor and the acquisition budget. The other two, growth and margin, are this chapter's, and margin is where the decade's discipline is most visible and most worth taking apart.
The record management grades itself against sits on the adjusted line. Adjusted operating margin expanded in each of the last five completed fiscal years and landed inside the ten-to-thirty band every time — 15.1% in FY2021, then 15.2%, 15.4%, 15.5%, and 15.6% in FY2025 — with FY2026 guided to a sixth year at 15.7% to 15.9% [1][2]. Five years, five landings inside the band. On the adjusted line, the promise has been kept without a miss.
The wedge
The line the auditor signs tells a different story. Reported (GAAP) operating margin was 15.1% in FY2021 and 14.7% in FY2025 — it ended the five years roughly forty basis points below where it started, having dipped to 13.7% in FY2023. Same company, same period: the preferred line expanded every year; the statutory line did not expand at all.
Source: adjusted margin from FY2025 Annual Report Financial Highlights [3] and Q4 FY2025 call [4]; GAAP margin from reported financials [5].
The gap between the two lines has a name and a dollar amount. It is a separate income-statement line called "Business optimization costs," and it has appeared — and been excluded from every headline metric management presents — in four consecutive fiscal years: $1,063.1 million in FY2023, $438.4 million in FY2024, $615.3 million in FY2025, and $307.5 million in the first quarter of FY2026 [6][7]. Cumulatively that is roughly $2.42 billion of cost that lands on the reported line and is lifted off the presented one. In FY2025 the wedge was worth $0.78 of earnings per share — adjusted EPS of $12.93 against GAAP EPS of $12.15 — and 90 basis points of margin [8].
Source: business optimization costs, FY2025 Annual Report Consolidated Income Statement [9].
Two features make the exclusion worth pausing on rather than waving through as ordinary restructuring. The first is recurrence. These are two distinct programs, not one: a fiscal-2023 action estimated at $1.5 billion and affecting roughly 19,000 people, which management declared "completed" on its September 2024 call — "We completed the business optimization actions we announced in March 2023 to reduce structural costs" — and a second six-month program initiated in the fourth quarter of FY2025, guided to roughly $865 million and running $923 million by the time the Q1 FY2026 charge was booked [10][11]. The second program began about twelve months after the first was called finished. An item excluded as non-recurring in four straight years is a cost of the operating model that the presented margin does not carry.
The second feature is what sits inside the FY2025 charge: $271 million of it is asset impairments "primarily related to the divestiture of two acquisitions in the Americas that are no longer aligned with our strategic priorities" [12]. The write-down of businesses the company itself bought is thus removed from the margin the company presents. None of this is an accounting failure — the amounts are disclosed on the face of the statements, in their own line, exactly where a reader can find them. It is a presentation choice. What follows is why the choice does more work than a footnote usually does.
The number that pays
The adjusted operating income is not only the number in the press release. It is the number management is graded and paid on. The largest single element of the chief executive's pay is a performance-share award whose vesting is 75% weighted to cumulative operating income and 25% to relative shareholder return [13]. The operating income reported into that program for the FY2023–FY2025 performance period was $9,873.0 million, $10,034.3 million, and $10,840.9 million. The GAAP operating income for the same three years was $8,809.9 million, $9,595.8 million, and $10,225.7 million. The three differences — $1,063.1 million, $438.4 million, $615.3 million — tie, to the dollar, to the business optimization costs [14][15]. The restructuring the company excludes from its headline margin is the same restructuring it excludes from the number that funds the award. No such add-back was made in FY2021 or FY2022, the two years the two lines in the chart above sit on top of each other.
The pay metric is also set on a moving bar. The proxy states that for each fiscal year of a three-year award, the committee approves an operating income plan; where targets for a period "had not yet been established," the disclosure assumes target performance. The bar and the measurement basis are both set by the same body after the performance period has begun.
Source: 2025 Proxy Statement, Pay Versus Performance footnote and Key Executive Performance Share Program [16][17].
The rest of the pay architecture — how much of it has actually been earned, the ownership the executives carry, the shareholder-return hurdle and how it was recently reset — belongs to the governance section of the capital chapter (Spending 1.8x Free Cash Flow). The point that belongs here is narrow and specific: the definitional choice that separates the presented margin from the filed one is also the choice that separates the pay metric from the filed one, and it runs the same direction in both.
The texture around the number
A margin held to tens of basis points a year is a managed number, and the filings show the management. Three items sit around the kept promise and are worth reading with the same care as the promise itself.
Research and development. Disclosed R&D expense fell from $1,298.7 million in FY2023 to $1,150.4 million in FY2024 to $817.3 million in FY2025 — a 37.1% cut over two years in which revenue grew from $64.1 billion to $69.7 billion [18]. As a share of revenue that is a fall from 2.03% to 1.17%, about 85 basis points — more than four times the roughly 20 basis points by which adjusted operating margin expanded over the same span. R&D is the largest discretionary line the company breaks out, and it moved down while the presented margin moved up. The composition of the FY2025 expansion is the same story in miniature: gross margin actually fell about 70 basis points, to 31.9% from 32.6%, and was more than paid for by an SG&A reduction of about 90 basis points, to 16.3% from 17.2% [19]. The ten basis points of expansion was a selling-cost reduction offsetting a delivery-cost increase, not operating leverage — and selling cost has a floor.
A scoreboard restated, and a scoreboard retired. The geographic segment definition changed in each of the last two fiscal years, with prior periods restated both times. The effect on the smallest segment is large: FY2023 revenue reported as "Growth Markets" of $12,531.0 million in the FY2023 10-K is presented in the FY2025 10-K as "Asia Pacific" revenue of $9,626.0 million — 23% less revenue for the identical year, with no change to the consolidated total [20][21]. Any multi-year segment series stitched from successive filings is not self-consistent. Separately, the advanced-AI bookings-and-revenue metric — introduced in mid-2023 to size the opportunity, and pointed to in the FY2025 shareholder letter, which described the fiscal-2023 decision to invest $3 billion in generative AI as having "positioned us to capture this new area of spend" [22] — was discontinued in December 2025, on the quarter it printed its highest-ever bookings: "This will be the last quarter in which we share these specific metrics," on the stated ground that AI is now embedded across nearly everything the company does [23]. The one quantified strategic bet of the last five years was delivered against and then removed from the scoreboard at its peak.
Said, then did, ninety-one days apart. On 19 March 2026 the finance chief said of the Middle East conflict, "Currently we are not seeing any significant financial impact," and raised full-year FY2026 revenue guidance [24]. On 18 June 2026 the same conflict was quantified at roughly $100 million of revenue below expectations and about $400 million of lost Middle East sales, two large managed-services deals were moved to FY2027, and full-year guidance was cut to 3%–4% local currency — the session on which the shares fell about 18% that the report opened with [25][26]. The opening line of that call was "In Q3, we delivered strong results" [27]. Against a decade of guidance that landed inside its original range every completed year, this is the one place where the language and the number diverged within a quarter.
The completed-year record deserves its due, because the pattern is real. Every one of the four finished years since FY2022 landed inside the original September revenue range management set:
Source: earnings calls Q4 FY2021 through Q3 FY2026; local-currency revenue guidance and outcomes [28][29][30].
The containment is genuine, but the September range spans 300 basis points, and it was the direction of the within-year revisions, not whether the year finished inside the band, that mattered each time: FY2022 and FY2025 were raised at every checkpoint; FY2023 and FY2024 were narrowed downward at every checkpoint. FY2026 is the first year in the corpus that was raised and then cut.
The receivables, and a tax the rate does not show
Two balance-sheet items move the wrong way underneath the kept margin, and both bear on how much of the reported profit is cash the company already holds.
Receivables have built faster than revenue for three years. Days services outstanding — the company's own quarterly disclosure — went from 42 days at the close of FY2023 to 46, then 47 at the close of FY2025, touched 51 days at 30 November 2025 (the highest reading in the series), and stood at 48 days at 31 May 2026 [31][32][33].
Source: quarterly earnings releases, Q4 FY2025 through Q3 FY2026 [34][35][36].
The absolute level is the lowest in the peer set — Accenture collects faster than any of its large listed rivals — and the provision for doubtful accounts was $11.6 million on $69.7 billion of revenue, so this is not a collectability worry [37]. It is a direction. Five days of DSO is roughly $950 million of cash on FY2025 revenue, and the contract working capital captured in the segment "net assets" line has climbed to $9,475 million from $7,625 million in FY2023 [38]. The one balance-sheet variable that scales with revenue has been a steady, one-way use of cash.
The second item is a tax exposure the effective rate does not display. Unrecognized tax benefits — amounts the company has booked as if it will keep, but which the tax authorities have not agreed it may — compounded to $2,409.7 million at 31 August 2025, up 79% over four years against revenue growth of 38% [39]. That is equal to about 31% of a full year's net income. The company states it is "reasonably possible" the balance could increase by approximately $1.4 billion within the next twelve months, the majority relating to transfer pricing, and it is negotiating a bilateral US–Ireland Advance Pricing Agreement covering fiscal 2021 through 2025 that it expects to conclude in fiscal 2026 or 2027 [40]. Transfer-pricing uncertainty is one of the two matters the auditor singled out as a Critical Audit Matter. The reported 23.7% effective tax rate does not carry the shape of that unresolved cash exposure; the note does.
The cash is real — which is why the choices matter
None of the above is a reason to doubt the earnings turn into cash. That is the base rate here, and it is a strong one. Free cash flow exceeded net income in every one of the last five years. Cumulatively, FY2021–FY2025 free cash flow of $45.7 billion was 1.32 times cumulative net income; charge the full $9.0 billion of share-based compensation against it — the most common quality adjustment, and one the reported figure does not make — and it is still 1.06 times [41]. And the record is clean by every formal test: KPMG, the auditor since 2002, issued unqualified opinions on both the FY2025 statements and internal control; Item 9, "Changes in and Disagreements With Accountants," reads "None" in each of the last five 10-Ks; there has been no restatement [42].
5-yr FCF / Net Income
After full SBC charge
FY2025 alone
FY2026 guided
Source: derived from reported financials, FY2021–FY2025 cash-flow and income statements [43]; FY2026 conversion per management guidance [44].
The one caution attaches to the year that anchors the trailing yield. FY2025 free cash flow of $10.9 billion produced a conversion ratio of 1.42 times — the strongest in the five years — but 65% of the year's $2.34 billion step-up in operating cash flow came from a single accrual: the "accrued payroll and related benefits" line of the cash-flow bridge swung from a $614.8 million use of cash in FY2024 to a $904.3 million source in FY2025, a $1,519 million favourable swing [45]. Net income over the same year rose only $413 million. Management itself did not guide the conversion to repeat: on the Q4 FY2025 call it described the FY2025 ratio as "a very strong free cash flow to net income ratio of 1.4" and set FY2026 at 1.2 [46]. Whether the FY2025 cash generation repeats once that accrual reverses is a question the valuation chapter carries.
Set the decade of ten-to-thirty-basis-point expansion against the shelf, and the result is modest. The kept promise has produced a GAAP operating margin of 14.7% that sits below Cognizant's 16.1%, and a free-cash-flow margin of 15.6% that sits below the peer median of 18.0% — the lowest capex intensity in the group has not translated into the highest cash margin.
Source: peer comparison, reported financials FY2025 (as reported).
The margin promise, then, is kept — on a line the company defines, grades itself against, and pays itself on, and which has drifted about forty basis points above the statutory line over five years through a cost the company excludes in four consecutive years. The drift is a presentation choice, not an accounting breakdown, and the cash underneath it is real and abundant. That is exactly why the choice matters more than a footnote usually would: the reader now knows which number is management's and which is the auditor's, and how wide the two have opened. What management does with the abundant cash — how much goes to buying growth and buying back stock, at what prices, and why FY2026 breaks a five-year pattern by adding the first debt in the company's public life — is the next act.
Spending 1.8x Free Cash Flow
Ten to Thirty Basis Points left the reader with a company that turns reported earnings into cash at an unusually high rate — $45.70 billion of free cash flow over FY2021 through FY2025, about 1.32 times net income, under a clean audit. This chapter follows that cash out the door. For five years it went to the same three destinations in almost the same proportions, on a formula so steady it reads like a rule. In FY2026 the rule is being broken on both sides at once: the company plans to spend roughly 1.8 times its free cash flow, take on debt for the first time in its public life, and shift the character of what it buys from people to software.
The formula that ran for five years
Over FY2021 through FY2025, Accenture generated $45.70 billion of free cash flow and put $21.29 billion of it into share purchases, $14.46 billion into dividends and $2.94 billion into property and equipment, while spending a further $18.20 billion on acquisitions of businesses and investments [1] [2]. Shareholder returns — buybacks plus dividends — came to $35.75 billion, or 78.2% of free cash flow, and the annual figure barely moved: 70.7%, 74.5%, 79.6%, 90.1% and 76.5% across the five years. Returns plus acquisitions ran to $53.96 billion, about 118% of free cash flow; the gap above internal cash was covered by $6.69 billion of proceeds from employee share issuance and, latterly, by debt.
Source: derived from the Consolidated Cash Flows Statements, FY2021–FY2025 annual filings [3] [4].
The steadiness is the point. Accenture publishes no target payout ratio, no return-on-invested-capital disclosure and no acquisition hurdle rate; what it publishes each September is a dollar floor for shareholder returns, and that floor has been met or beaten every year on record — at least $6.3 billion promised and $6.6 billion returned in FY2022, rising to at least $8.3 billion promised and $8.3 billion returned in FY2025, with the quarterly dividend lifted roughly 10% a year to $1.63 [5]. The floor is honoured mechanically, which is what makes the two components underneath it worth separating: one of them did far less than its headline suggests, and the other is where the money and the risk actually sit.
The buyback that barely moved the count
The $21.29 billion of share purchases over five years reduced the diluted share count from 645.91 million to 632.44 million — a cumulative 2.1% [6]. The reason the largest discretionary use of cash produced the smallest change in the share base is that a second stream of shares ran the other way. Share-based compensation expense over the same five years was $8.97 billion, and roughly 41.2 million Class A shares were issued to employees, bringing in $6.69 billion of cash equal to nearly a third of the gross buyback. And of the $4.61 billion Accenture spent on its own shares in FY2025, $776 million was share withholding for employees' payroll taxes on vesting equity — purchases that, by the company's own disclosure, do not consume repurchase authorization at all [7].
The buyback, in other words, has functioned mostly as an offset to dilution from employee equity rather than as a shrinking of the base. That distinction sharpens against the price paid. The 57.3 million shares Accenture bought in the open market over FY2021 through FY2025 cost $17.42 billion, an average of $303.83 per share; the pace then continued into a falling market, at $245.32 in the first quarter of FY2026, $246.09 in the second and $198.84 in the third [8] [9] [10] [11]. The close on 31 July 2026 was $165.92 — below every one of those averages.
Source: Note 14 share-purchase tables, FY2021–FY2025 Forms 10-K, and quarterly earnings calls; the 31 July 2026 close of $165.92 (dashed reference in text) sits below all eight bars [12] [13].
Avg open-market price, FY2021–25
Close, 31 July 2026
5-yr diluted share-count reduction
Source: derived from Note 14 share-purchase tables and data/prices/daily.json [14].
As arithmetic, the 57.3 million shares bought for $17.42 billion are worth $9.51 billion at the 31 July close — a $7.9 billion decline in the value of what was purchased, before any judgment about the decisions. That the pace held into the decline is a choice management made explicitly: on 23 June 2026, five days after cutting the year, the board added $2 billion to the FY2026 repurchase program, taking it to $7.5 billion and a 62% increase over FY2025, with the CEO stating that "we do not believe our current share price reflects that position or the strength of our business fundamentals" [15].
That top-up also underlines how the authorization now works. The board has authorized an aggregate $54.1 billion for repurchases since 2001, but the available balance is refilled in roughly annual tranches: $2,851 million at 31 August 2025, topped up by $5,000 million that September, drawn to about $3.2 billion by 31 May 2026 and expected to leave roughly $1 billion after Q4 [16] [17]. At the current pace a $5 billion authorization lasts under four quarters, so future buybacks depend on board top-ups rather than standing headroom.
Acquisitions no one priced
The $18.20 billion spent on acquisitions over five years is disclosed in a single sentence per year. Note 6 of each 10-K reports that Accenture "completed a number of individually immaterial acquisitions," gives one line each for total consideration, goodwill and intangibles, and names no target, no purchase price, no acquired revenue and no acquired margin [18]. Between 82% and 90% of consideration lands in goodwill every year, and goodwill reached $22.54 billion at 31 August 2025 — 69.9% of the company's $32.24 billion of total shareholders' equity — carried without a single impairment in FY2024 or FY2025 [19]. The only disposition of the period was the FY2022 exit from Russia, a $96.3 million non-operating loss.
Because no deal is priced, the only way to judge the program is against management's own measure of what it bought: the inorganic contribution to revenue growth. Lined up by year, that measure exposes the awkward pairing at the centre of the record — the biggest spending year was the weakest growth year. FY2024 saw $6.58 billion deployed, the largest acquisition outlay in the company's history, in the year revenue grew 1.2%, the slowest of the five; management described it as "$6.6 billion in strategic acquisitions" delivering "2% growth in local currency" [20].
Source: Consolidated Cash Flows Statements and quarterly guidance; revenue growth from reported financials [21] [22] [23].
A note on the numbers behind that table: the structured financials feed carries acquisition cash as zero for every year, contradicting the cash-flow statements, so every acquisition figure here is read from the filings themselves rather than the data series. Management's inorganic contribution has ranged from about 5% in FY2022 down to about 1.5% guided for FY2026 — the only published gauge of whether $18.20 billion of deals earned their keep, and a self-reported one.
The break
For five years the framework flexed acquisitions inside the residual left after the dividend and the buyback, and self-funded the whole of it. FY2026 raises both legs at the same time. Acquisition guidance, given at about $3 billion in September 2025, moved to about $9 billion by 18 June 2026 after a run of deals; shareholder-return guidance went from at least $9.3 billion to at least $9.5 billion, and the 23 June buyback increase pushed planned repurchases to $7.5 billion, implying roughly $11.5 billion of total returns [24] [25] [26]. Set against guided free cash flow of $10.8 billion to $11.5 billion, the combined roughly $20.5 billion of planned uses is about 1.8 times the cash the business is expected to generate [27].
Source: derived from the FY2021–FY2025 cash flow statements and FY2026 guidance; "returns and M&A" is buybacks plus dividends plus acquisitions [28] [29].
The gap is being funded two ways. The cash balance is being drawn down — from $11.5 billion at 31 August 2025 to $10.2 billion nine months later — and the balance sheet, run at net cash for two decades, has become a funding source [30]. Accenture carried no long-term debt through FY2023; on 4 October 2024 a finance subsidiary issued $5.0 billion of senior unsecured notes in four tranches maturing 2027 to 2034, with no financial covenants, and on 18 June 2026 the CFO said the company expects to access the long-term debt market again for its elevated acquisition outlook, while keeping "a strong investment grade credit rating with a low net leverage ratio" [31] [32]. No target leverage ratio has been published; that qualitative phrase is the only quantitative-adjacent commitment on record.
What changed is not only the size of the acquisition budget but the kind of thing it buys. The FY2026 deals move away from services tuck-ins toward software and product platforms: a majority stake in Dragos plus all of runZero and NetRise in operational-technology security, and Ookla, a 430-person business with about $231 million of 2025 revenue earned from subscriptions and licensing [33]. Management frames the intent as moving revenue toward models that are not billed by the hour. That is the first allocation move in five years capable of changing the labour arithmetic laid out in The 800,000-Person Payroll rather than adding to it — and because none of these deals carries a disclosed price, whether it reshapes the model or simply buys revenue at unknown multiples is a question this chapter can pose but not settle. It belongs to Priced at $165.92.
Who is making these calls
The people directing this cash are a fully home-grown bench: every executive officer named in the FY2025 10-K is an internal promotion of twelve to thirty-nine years' standing [34]. They answer to a conventional-to-strong board with no control block — ten directors, nine of them independent, Julie Sweet as combined chair and CEO with Arun Sarin the independent Lead Director since February 2025, all committees fully independent and a retirement age of 75 [35]. The only holders above 5% are index managers — Vanguard at 10.4% and BlackRock at 7.8% — with Accenture itself holding 6.8% of the Class A shares as non-voting treasury [36].
What that board and bench do not have is much of their own money in the stock. As of 1 December 2025, all 21 directors and executive officers together beneficially owned 144,910 Class A shares — roughly 0.02% of the base against which Vanguard's stake is 10.4% [37] [38]. Sweet held 6,906 shares, of which 2,339 are units deliverable within sixty days, leaving about 4,567 owned outright — worth roughly $0.8 million at the July close, against the $19.9 million she realized on vesting equity in fiscal 2025 alone [39] [40]. The ownership requirement meant to supply alignment is set at six times base salary but is satisfiable with "unvested equity," so it clears on the forward grant stream before any purchased share is counted; the independent directors' own guideline, by contrast, counts only shares held and vested awards — the company draws the distinction for its directors that it waives for its officers [41].
Two design choices in the pay machinery shape how that grant stream is earned, and both were resolved in management's favour in a year of poor shareholder returns. The annual bonus is explicitly non-formulaic: the scorecard is weighted 60% financial and 40% strategic, but the proxy states the company applies no formula and no predetermined weighting and that no single objective is material, so the "exceeds" rating that produced Sweet's raised $4.5 million fiscal-2025 bonus cannot be reconstructed from disclosed inputs [42]. That "exceeds" was awarded in the same year the proxy discloses a three-year total shareholder return at the 3rd percentile of the compensation peer group, with $100 invested in Accenture on 31 August 2020 worth $117 five years later against $251 for the S&P 500 Information Technology index [43] [44].
The second choice is the relative-TSR hurdle inside the largest equity award — the 25% of it not governed by the adjusted operating-income metric examined in Ten to Thirty Basis Points. After the return components of two consecutive grants paid out at 0%, the committee, for awards granted in January 2026, lowered the entry threshold from the 40th to the 30th percentile and replaced a sixteen-company technology-and-consulting comparison group with the whole of the S&P 500 [45]. Both changes reduce the return needed to earn the same equity, and both took effect after the returns that would have failed the old bar.
The counterweight is that the machinery has, on the reported side, bitten. Compensation actually paid to Sweet fell from $37.4 million in FY2021 to $16.6 million in FY2025 — down 56%, and 44% below her $29.6 million reported package that year — as the two zero relative-TSR payouts flowed through [46]. Realized pay tracked the stock down even as headline grant values held up, so the same disclosures that show generous targets also show the targets going largely unmet. What a reader is left with is not a governance defect — there is no promoter, no dual-class control, no structural flaw — but a set of discretionary levers, each adjusted at the moment the stock made the prior settings expensive.
The allocation formula, the buyback that offsets dilution at prices above today's, the acquisitions that carry no price tag, the FY2026 break to 1.8 times cash flow, and the bench and board steering all of it now sit on the table. The final act prices them: what the $165.92 share embeds, what six months of the drawdown did and did not change in the estimates, and the dated events that will test the questions this record leaves open.
Priced at $165.92
Between April and the end of July 2026, Accenture's shares lost and then partly regained roughly a third of their value while the earnings the company is expected to produce barely moved. That gap — a large price change sitting on top of a small numbers change — is the whole of this closing act. The reader arrives holding the pieces: a payroll-and-client-list business whose unit price the company says it cannot measure, a margin promise kept on the adjusted line, and an FY2026 plan that spends about 1.8 times free cash flow across acquisitions and buybacks. What follows is the price the market has put on all of it, stated as arithmetic, and the dated occasions on which that arithmetic gets tested.
The reaction came on the 18 June results, whose beat-and-raise print — one trim to the top of the local-currency revenue range, a softer order book, and raised guidance and cash-return floors — The 800,000-Person Payroll sets out in full. What the repricing case needs from that day is its size and its shape: the single-session fall ran on 41.7 million shares, about eight times the April daily average, even as the company beat consensus adjusted EPS ($3.80 against roughly $3.71). The market moved the price, not the earnings — the gap the next section takes apart.
A re-rating, not a downgrade
The de-rating is far larger than the estimate revision behind it. Over the six months to 31 July 2026, consensus FY2027 normalized EPS moved from $14.89 to $14.68 — a 1.4% cut — and FY2028 from $16.16 to $15.79, a 2.3% cut; the FY2027 and FY2028 revenue lines came down 1.7% and 2.4% on the same marks, so the trim is a top-line trim, not a margin call.
Source: consensus normalized-EPS and revenue marks (180-day vs current), and the 52-week price range, as reported. Estimate momentum from consensus data; 52-week high $291.09.
Against a consensus that moved by one to two points, the stock at $165.92 is 43.0% below its 52-week high of $291.09 [1]. Expressed as a multiple on unchanged FY2027 consensus EPS, the shares moved from about 19.8 times at that high to 11.3 times at the July close. The numbers the company is expected to earn are close to where they were; almost the entire change is in what a dollar of those earnings costs.
The recovery is the same mechanism in reverse. The closing low was $124.44 on 30 June 2026; by 31 July the stock had risen 33.3% to $165.92, its five best sessions of the four-month price file all falling in July. Over that same stretch the estimate revisions were inert — every 30-day change in FY2027 and FY2028 revenue and EPS sits inside 0.1% — and the corpus holds no dated news item after 27 June. A third of the current quote was added in a month with no change in the consensus underneath it, which makes the entry point unusually sensitive to sentiment rather than to numbers.
Source: daily closing prices, as reported. The 18 June session marks the −17.97% drop; the closing low of $124.44 was set 30 June. The price file covers only 1 April to 31 July 2026.
The drawdown that isn't
The single most quotable relative-valuation figure in this run reverses direction once the windows are matched. The company's own price history in the corpus covers just 84 sessions, from 1 April to 31 July 2026, and is flagged as partial. The "-17.6% drawdown from a three-year high" that the facts table reports is therefore measured against a four-month high of $201.33, not a genuine three-year peak. Every peer file, by contrast, holds five years of sessions, so the peer drawdowns — IBM −32.1%, Cognizant −39.0%, TCS −48.1%, Infosys −43.5%, HCLTech −32.5%, a −39.0% median — are true multi-year figures. Measured on the nearest comparable basis, Accenture's own 52-week high of $291.09, the decline to $165.92 is 43.0%, in line with the peer median rather than less than half of it.
Source: peer drawdowns over five-year windows, as reported; Accenture's four-month-window figure from the run's valuation series; Accenture's 52-week figure derived from the $291.09 52-week high and the $165.92 close.
The distinction matters because the four-month figure is the one that invites the conclusion that Accenture fell less than its peers. On matched windows it fell about the same. Whatever the market repriced, it repriced Accenture roughly as hard as the rest of the group.
What the price embeds
At the 31 July close the equity is capitalized at $104.93 billion. That price carries 12.0 times FY2026 and 11.3 times FY2027 consensus normalized EPS ($13.87 and $14.68), a 10.4% trailing and 10.7% forward-consensus free-cash-flow yield, and a guided capital return of at least $9.5 billion — equal to 9.1% of market capitalization — for the year in progress.
FY2026 P/E (x)
FY2027 P/E (x)
Trailing FCF Yield
Forward FCF Yield
Guided Cash Return / Mkt Cap
Source: multiples derived from the $165.92 close and FY2026/FY2027 consensus normalized EPS [2]; free-cash-flow yields per the run's valuation series; capital return of at least $9.5 billion from Q3 FY2026 guidance [3].
The return at this price is dominated by the cash yield and the share-count arithmetic, not by growth — and the growth the price does embed is mostly bought. Consensus FY2027 revenue of $76.61 billion is 4.1% above FY2026, but management said on the Q3 call that it expects to enter FY2027 with "slightly below 2%" of inorganic growth [4]. That inorganic contribution is funded by the roughly $9 billion of FY2026 acquisitions the company now plans [5]. Broker models put the organic line near 1.85%. A buyer at $165.92 is underwriting roughly 2% organic growth, plus purchased revenue, plus a slow grind of operating margin — consensus moves it about 45 basis points over three years — not the mid-single-digit organic figure the headline growth rate suggests.
Sources: consensus FY2027 revenue growth as reported; the acquired share from management's Q3 FY2026 call [6]; the organic residual from broker models. The components draw on different sources and do not sum precisely.
The other half of the return is cash coming back. In Q3 FY2026 alone the company returned $2.2 billion — $1.2 billion repurchasing or redeeming 6.0 million shares and $1.0 billion in dividends at $1.63 per share, a 10% increase over the FY2025 rate — leaving roughly $3.2 billion of repurchase authority at 31 May 2026 [7]. At a 10.7% forward free-cash-flow yield the guided payout alone is close to a tenth of market value in a single year, and that is the arithmetic that dominates the outcome at this price. The caveat carried forward from the cash-quality act (Ten to Thirty Basis Points) applies directly here: FY2025's 1.42x cash conversion — the anchor of the trailing yield — was lifted about 65% by a $1,519 million accrued-payroll swing that management itself guides back toward 1.2x in FY2026. The yield is real; whether it repeats at FY2025's level is the open question the buyer inherits.
The disagreement, priced
The sell-side posture is neutral and its dispersion is wide. Across 25 targets the mean is $178.89 and the median $179.00 — about 8% above the close — inside a range that runs from a $130 low to a $275 high, more than double the low [8]. The rating split is 11 strong-buy, 3 buy and 13 hold, with no sell and no underperform; five price-target cuts landed in the trailing 90 days, and three of the most recent dated actions — DBS to $133, Susquehanna at $140, Deutsche Bank to $136 — sit below the current price [9]. The July rally carried the quote above several of the most recently published targets, so the marginal buyer is ahead of a coverage base that has stopped cutting but has not re-engaged.
The wide target range hides a narrow disagreement about the actual income statement. Thirteen brokers cluster FY2028 operating margin between 15.74% and 16.20%; the modeled near-term profit line is close to settled. The dispersion lives in the per-share and narrative inputs — the pace of the buyback, the free-cash-flow level, the delivery headcount, and how much AI-related bookings translate into revenue — rather than in the next two years of earnings. That is consistent with a market that repriced the durability of the model rather than its forecast: the contest over who sets the price of an hour of labour (Who Sets the Unit Price) is precisely the kind of question a multiple, not an estimate, absorbs.
Sources: cash conversion and buyback economics from the cash-quality and capital-allocation acts [10]; forward-growth split from the Q3 FY2026 call [11]; AI-deflation and peer-outgrowth evidence developed earlier in the report.
What is still open, and when it gets tested
Five questions decide which of those reads is right, and none can be closed from the current corpus. Whether FY2025's cash conversion repeats once the $1,519 million accrued-payroll swing reverses. Whether the roughly $9 billion of FY2026 software and platform acquisitions changes the labour model or merely buys revenue at prices the company does not disclose — the allocation act (Spending 1.8x Free Cash Flow) framed this deal shift and left it deliberately open. Whether a buyback that has run at an average $303.83 against a $165.92 close is a return of capital or a deferred bet on the price recovering. Whether consensus organic growth near 1.85% is too low or too high. And whether the AI price deflation peers are already quantifying reaches this book of work through renewals of its fixed-price contracts.
Two of these are self-reversing items already sized and sitting in the FY2026 base. Management attributes about a point of the local-currency revenue drag to the U.S. federal business and expects to anniversary that headwind and return the unit to growth in the fourth quarter [12]; separately it quantified roughly $100 million of Q3 revenue impact from the Middle East conflict, all in consulting-type work [13] — the March-to-June said-did divergence that Ten to Thirty Basis Points develops in full. Both are dated, both are sized, and both are embedded in the base off which FY2027 consensus is built.
The calendar puts firm dates on the resolution. Initial FY2027 guidance — the first real test of the just-under-2%-inorganic and roughly-2%-organic framing — lands on the fiscal fourth-quarter call and the investor day that follows it.
Source: Accenture investor-relations events calendar, as published [14].
What the market repriced this summer was the durability of an hour of Accenture's labour, not the next two years of its earnings, which barely moved. On the evidence, $165.92 pays for a business whose return is carried by a roughly 10% cash yield and a shrinking share count rather than by growth, and whose growth is about half acquired at prices never disclosed. The strongest fact against reading that as conservative is that the same cash yield rests on a conversion rate management expects to fall, and the buyback that would compound it was executed well above today's price. Whether the July recovery was the market looking through a demand air-pocket or front-running a re-rating it has not yet earned is the disagreement that the 1 October call and the 14 October investor day will begin to settle — the first moment the company puts a number on FY2027 against a price that has already moved twice this summer without one.
The numbers behind Accenture plc: as-reported financial statements and company metrics for FY2021–FY2025, traced to the source filings, opened with the share-price history those statements have to justify. Every linked figure opens the exact page of the filing it was printed on, with the statement row highlighted. Amounts in US$ thousands unless noted.
Reading notes: All figures are in the display scale Accenture's statements print: (In thousands of U.S. dollars, except share and per share amounts). FY2025 revenues of $69.7 billion appear as 69,672,977. FY2021 statement figures are cited to the fiscal 2021 comparative column of the FY2022 Form 10-K. Accenture's own FY2021 filing in this corpus is its Irish statutory Directors' Report, which carries the same numbers under Companies Act captions (Turnover, Operating profit, Profit for the financial year); the 10-K comparative keeps labels consistent across the table. Business optimization costs were not a separate income-statement line in the FY2022 Form 10-K, so FY2021 and FY2022 are left blank rather than shown as zero. Intangibles were first presented separately on the balance sheet in the FY2024 Form 10-K, which also recast the August 31, 2023 comparative; FY2021 and FY2022 are blank for that row.
Share Price — Available History Since April 2026
The stock closed at $165.92 on Jul 31, 2026 — down 16% over the window shown, trading between $124.44 and $201.33. At that close the stock trades at 14× FY2025 diluted EPS as reported below.
Source: market price feed, daily closes, Apr 2026–Jul 2026 — the feed marks this available history as partial. Price return only, excludes dividends.
Market capitalization $104.9bn.
Market cap = 632.4M shares outstanding × the Jul 31, 2026 close of $165.92. Market-derived, shown without filing links.
FY2025 at a Glance
Revenue (US$ thousands)
Operating income (US$ thousands)
Net income (US$ thousands)
Diluted EPS
Source: FY2025 consolidated statements [1] [2] [3] [4]. Click any linked figure to open the filing page with the row highlighted.
Revenues by Industry Group
| Revenues by Industry Group | FY2021 | FY2022 | FY2023 | FY2024 | FY2025 |
|---|---|---|---|---|---|
| Communications, Media and Technology | 9,801,349 | 12,199,797 | 11,452,914 | 10,837,174 | 11,453,982 |
| Financial Services | 9,932,523 | 11,810,582 | 12,131,531 | 11,610,225 | 12,773,856 |
| Health and Public Service | 9,498,234 | 11,226,464 | 12,560,458 | 13,840,634 | 14,762,837 |
| Products | 14,438,537 | 18,275,419 | 19,103,892 | 19,554,154 | 21,197,397 |
| Resources | 6,862,746 | 8,082,043 | 8,862,950 | 9,054,277 | 9,484,905 |
| Total revenues | 50,533,389 | 61,594,305 | 64,111,745 | 64,896,464 | 69,672,977 |
| Total revenues growth, derived | — | +21.9% | +4.1% | +1.2% | +7.4% |
Source: Form 10-K Note 16 (Segment Reporting) — revenues by industry group [5] [6] [7] [8]. Click any linked figure to open the filing page with the row highlighted.
Revenues and Operating Income by Geographic Market
| Revenues and Operating Income by Geographic Market | FY2021 | FY2022 | FY2023 | FY2024 | FY2025 |
|---|---|---|---|---|---|
| Americas revenues | — | — | 32,193,134 | 32,552,489 | 35,056,715 |
| EMEA revenues | — | — | 22,292,584 | 22,817,879 | 24,643,957 |
| Asia Pacific revenues | — | — | 9,626,027 | 9,526,096 | 9,972,305 |
| Total revenues | — | — | 64,111,745 | 64,896,464 | 69,672,977 |
| Americas operating income | — | — | 4,644,431 | 5,079,651 | 5,324,339 |
| EMEA operating income | — | — | 2,483,483 | 2,803,610 | 3,090,993 |
| Asia Pacific operating income | — | — | 1,681,975 | 1,712,586 | 1,810,332 |
| Total operating income | — | — | 8,809,889 | 9,595,847 | 10,225,664 |
Source: FY2025 Form 10-K Note 16 (Segment Reporting). FY2023 and FY2024 are shown on the current Americas / EMEA / Asia Pacific basis as recast in the FY2025 10-K; the corpus does not report FY2021 or FY2022 on this basis. [9]. Click any linked figure to open the filing page with the row highlighted.
Income Statement
Source: Consolidated Income Statements [1] [2] [3] [4]. Click any linked figure to open the filing page with the row highlighted.
Columns marked E are consensus analyst estimates from S&P Capital IQ (CapIQ), shown alongside reported results for direct comparison; they are not company guidance.
Estimate source: S&P Capital IQ (CapIQ) consensus, as of 2026-08-01. Estimate figures are S&P Capital IQ consensus (vendor data — no filing page links). EPS and net income use the normalized (adjusted) consensus where the street reports it. Line-item analyst models (segments, drivers, KPIs) are in the Visible Alpha tab.
Balance Sheet
Source: Consolidated Balance Sheets [10] [11] [12] [13]. Click any linked figure to open the filing page with the row highlighted.
Cash Flow
Source: Consolidated Cash Flows Statements [14] [15] [16] [17]. Click any linked figure to open the filing page with the row highlighted.
Revenues by Type of Work
| Revenues by Type of Work | FY2021 | FY2022 | FY2023 | FY2024 | FY2025 |
|---|---|---|---|---|---|
| Consulting | 27,337,699 | 34,075,856 | 33,613,008 | 33,195,104 | 35,106,786 |
| Managed Services | 23,195,690 | 27,518,449 | 30,498,737 | 31,701,360 | 34,566,191 |
| Total revenues | 50,533,389 | 61,594,305 | 64,111,745 | 64,896,464 | 69,672,977 |
Source: Form 10-K Note 16 (Segment Reporting) — revenues by type of work [5] [6] [7]. Click any linked figure to open the filing page with the row highlighted.
New Bookings and Demand
| New Bookings and Demand | FY2021 | FY2022 | FY2023 | FY2024 | FY2025 |
|---|---|---|---|---|---|
| Consulting new bookings | 30,600,000 | 37,900,000 | 36,200,000 | 37,000,000 | 37,600,000 |
| Managed Services new bookings | 28,700,000 | 33,900,000 | 36,000,000 | 44,200,000 | 43,000,000 |
| Total new bookings | 59,300,000 | 71,700,000 | 72,200,000 | 81,200,000 | 80,600,000 |
| New GenAI bookings | — | — | — | 3,000,000 | 5,900,000 |
| Clients with quarterly bookings over $100M | — | 100 | 106 | 125 | 129 |
Source: company filings [18] [19] [20] [21]. Click any linked figure to open the filing page with the row highlighted.
Workforce and Delivery
| Workforce and Delivery | FY2021 | FY2022 | FY2023 | FY2024 | FY2025 |
|---|---|---|---|---|---|
| Workforce (people, end of period) | 624,000 | 721,000 | 733,000 | 774,000 | 779,000 |
| Utilization | 93.0% | 91.0% | 91.0% | 92.0% | 92.0% |
| Voluntary attrition (excl. involuntary) | 14.0% | 19.0% | 13.0% | 13.0% | 14.0% |
Source: company filings [19] [22] [23] [24]. Click any linked figure to open the filing page with the row highlighted.
Profitability, Tax and Working Capital
| Profitability, Tax and Working Capital | FY2021 | FY2022 | FY2023 | FY2024 | FY2025 |
|---|---|---|---|---|---|
| Operating margin (GAAP) | 15.1% | 15.2% | 13.7% | 14.8% | 14.7% |
| Adjusted operating margin | — | — | 15.4% | 15.5% | 15.6% |
| Effective tax rate | 22.8% | 24.0% | 23.4% | 23.5% | 23.7% |
| Days services outstanding (DSO), fiscal year-end | — | 43 | 42 | 46 | 47 |
Source: company filings [25] [26] [27] [28]. Click any linked figure to open the filing page with the row highlighted.
Long-Term Record
| Fiscal year | Total revenues | Operating income | Net income attributable to Accenture plc | Diluted earnings per Class A ordinary share | Net cash provided by (used in) operating activities | Purchases of property and equipment | Total shareholders' equity |
|---|---|---|---|---|---|---|---|
| FY2016 | 34,797,661 | 4,810,445 | 4,111,892 | 6.45 | 4,667,400 | (496,566) | 8,189,376 |
| FY2017 | 36,176,841 | 5,191,402 | 3,445,149 | 5.44 | 4,973,039 | (515,919) | 9,710,200 |
| FY2018 | 40,992,534 | 5,898,779 | 4,059,907 | 6.34 | 6,026,691 | (619,187) | 10,724,588 |
| FY2019 | 43,215,013 | 6,305,074 | 4,779,112 | 7.36 | 6,626,953 | (599,009) | 14,827,691 |
| FY2020 | 44,327,039 | 6,513,644 | 5,107,839 | 7.89 | 8,215,152 | (599,132) | 17,499,173 |
| FY2021 | 50,533,389 | 7,621,529 | 5,906,809 | 9.16 | 8,975,148 | (580,132) | 20,097,114 |
| FY2022 | 61,594,305 | 9,367,181 | 6,877,169 | 10.71 | 9,541,129 | (717,998) | 22,747,088 |
| FY2023 | 64,111,745 | 8,809,889 | 6,871,557 | 10.77 | 9,524,268 | (528,172) | 26,458,593 |
| FY2024 | 64,896,464 | 9,595,847 | 7,264,787 | 11.44 | 9,131,027 | (516,509) | 29,168,248 |
| FY2025 | 69,672,977 | 10,225,664 | 7,678,433 | 12.15 | 11,474,399 | (600,039) | 32,240,967 |
Source: consolidated statements across filings; older years from the standardized feed [14] [1] [10] [15]. Click any linked figure to open the filing page with the row highlighted.
Operating KPIs
| KPI | FY2021 | FY2022 | FY2023 | FY2024 | FY2025 |
|---|---|---|---|---|---|
| New bookings, US$ billions | 59.3 | 71.7 | 72.2 | 81.2 | 80.6 |
| Workforce at fiscal year end | 624,000 | 721,000 | 733,000 | 774,000 | 779,000 |
| Utilization | 93% | 91% | 91% | 92% | 92% |
| Voluntary attrition | 14% | 19% | 13% | 13% | 14% |
Source: company-reported operating metrics [19] [22] [29] [23]. Click any linked figure to open the filing page with the row highlighted.
Analyst Consensus
Mean target
Median target
High target
Low target
Street ratings: 11 strong buy, 3 buy, 13 hold. Consensus: Buy.
Estimate source: S&P Capital IQ (CapIQ) consensus, as of 2026-08-01. Estimate figures are S&P Capital IQ consensus (vendor data — no filing page links). EPS and net income use the normalized (adjusted) consensus where the street reports it. Line-item analyst models (segments, drivers, KPIs) are in the Visible Alpha tab.
Traceability
620 of 642 figures on this page (97%) link to the filing page where they are printed — click a linked figure to open the source PDF at that page with the row highlighted. Unlinked figures come from standardized data feeds or pre-filing years.
All figures are in the display scale Accenture's statements print: (In thousands of U.S. dollars, except share and per share amounts). FY2025 revenues of $69.7 billion appear as 69,672,977.
FY2021 statement figures are cited to the fiscal 2021 comparative column of the FY2022 Form 10-K. Accenture's own FY2021 filing in this corpus is its Irish statutory Directors' Report, which carries the same numbers under Companies Act captions (Turnover, Operating profit, Profit for the financial year); the 10-K comparative keeps labels consistent across the table.
Business optimization costs were not a separate income-statement line in the FY2022 Form 10-K, so FY2021 and FY2022 are left blank rather than shown as zero.
Intangibles were first presented separately on the balance sheet in the FY2024 Form 10-K, which also recast the August 31, 2023 comparative; FY2021 and FY2022 are blank for that row.
Accenture redefined its geographic segments twice inside this window: Middle East and Africa moved from Growth Markets to Europe in Q1 FY2024 (creating EMEA), and Latin America moved from Growth Markets to North America in Q1 FY2025 (creating the Americas and Asia Pacific). The geographic segment table therefore runs FY2023-FY2025 only, on the current basis as recast in the FY2025 10-K. Revenues by industry group and by type of work are comparable across all five years.
FY2016-FY2018 long-term figures come from the standardized data feed and are shown without page links. Those 10-Ks headlined Net revenues excluding reimbursements (FY2016: 32,882,723); the feed figures are total revenues including reimbursements, the basis used from FY2019 onward under Topic 606.
New bookings are disclosed only in billions rounded to one decimal, so that KPI is stated in US$ billions rather than the tab's thousands scale; its label says so.
Quarterly figures come from Accenture's quarterly results releases, which print a three-months-ended column for both the income statement and the cash-flow statement. No single quarter is derived from year-to-date data.
The FY2023 Form 10-K PDF's text layer uses a scrambled custom font encoding. Those citations were verified against the PageIndex page content, and page identity was confirmed by decoding the font offset; text highlighting on that document may fall back to a plain page jump.
4 figure(s) differed between the data feed and the filing; the filing value is shown (see the run's metrics/metrics_tab.json for the audit trail).
Accenture plc's management explains the business in its own materials. The slides below do the most of that work, pulled from the documents preserved in Sources. Each source link opens the complete presentation at that slide in a new tab.
Q3 FY2026 Earnings Presentation — Q3 FY2026
The most recent deck, and the one where management lays out the cybersecurity platform build and the new mid-market business. · Open the full document →
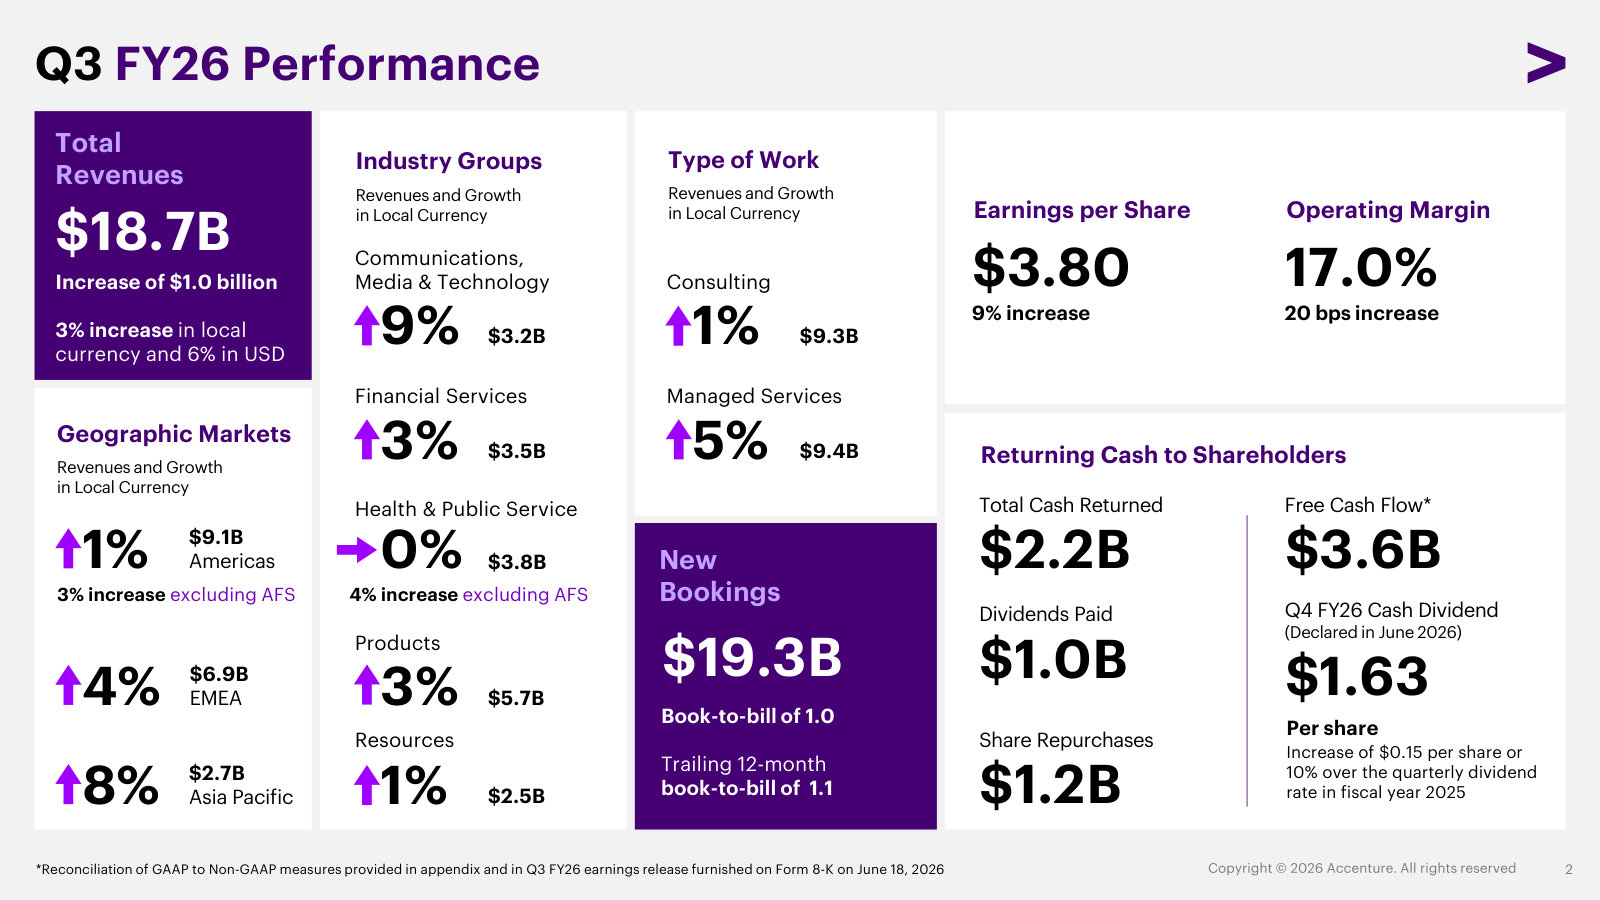
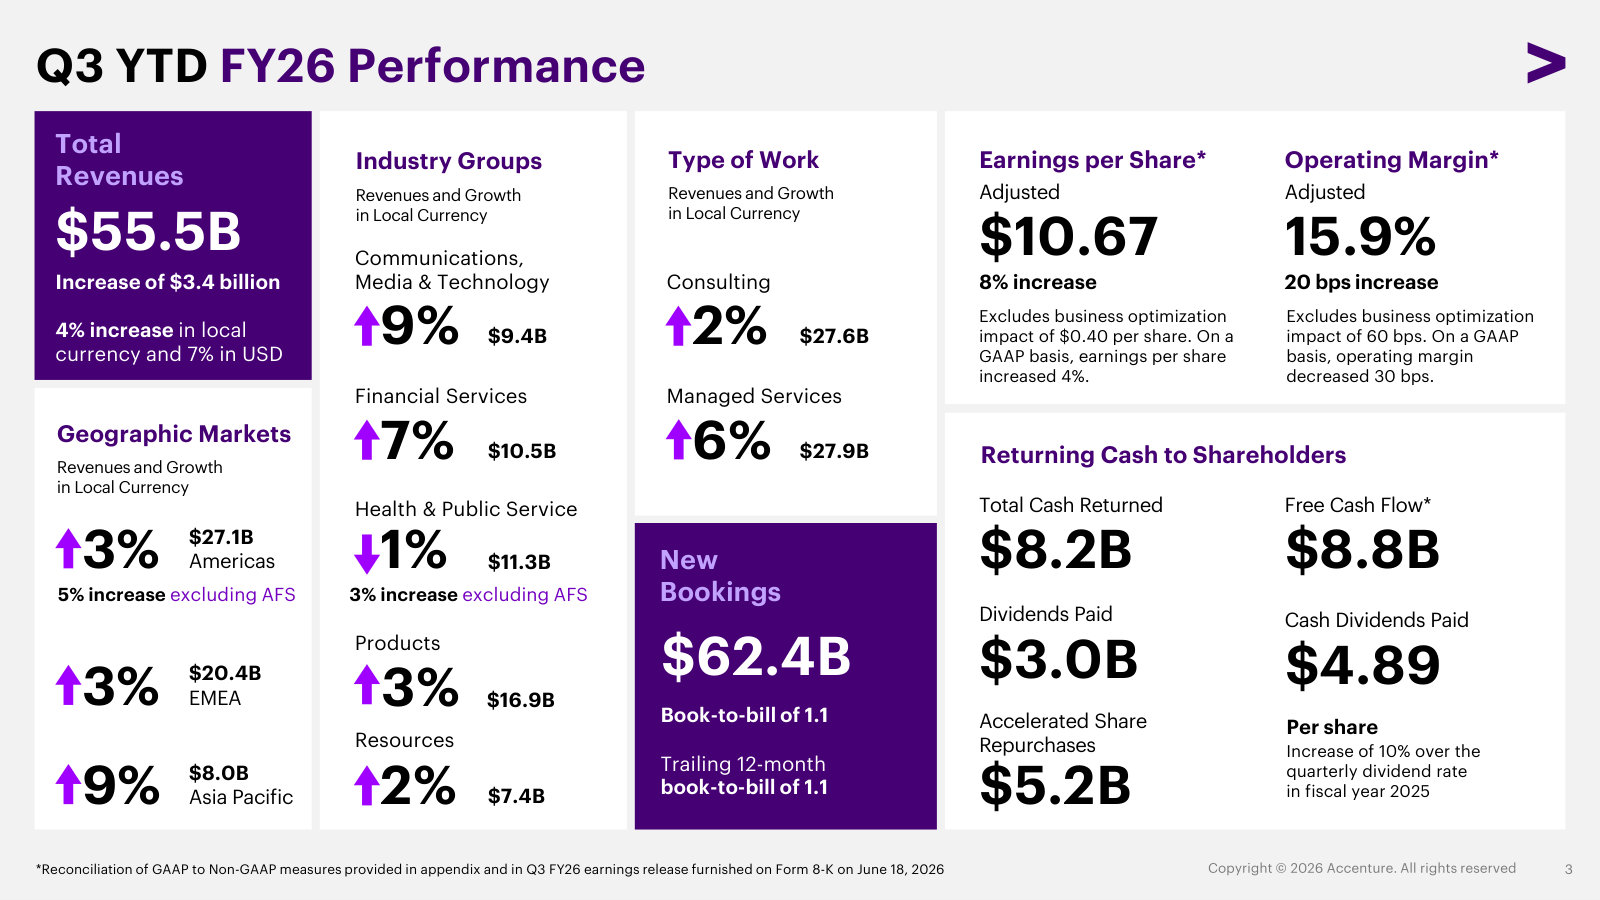
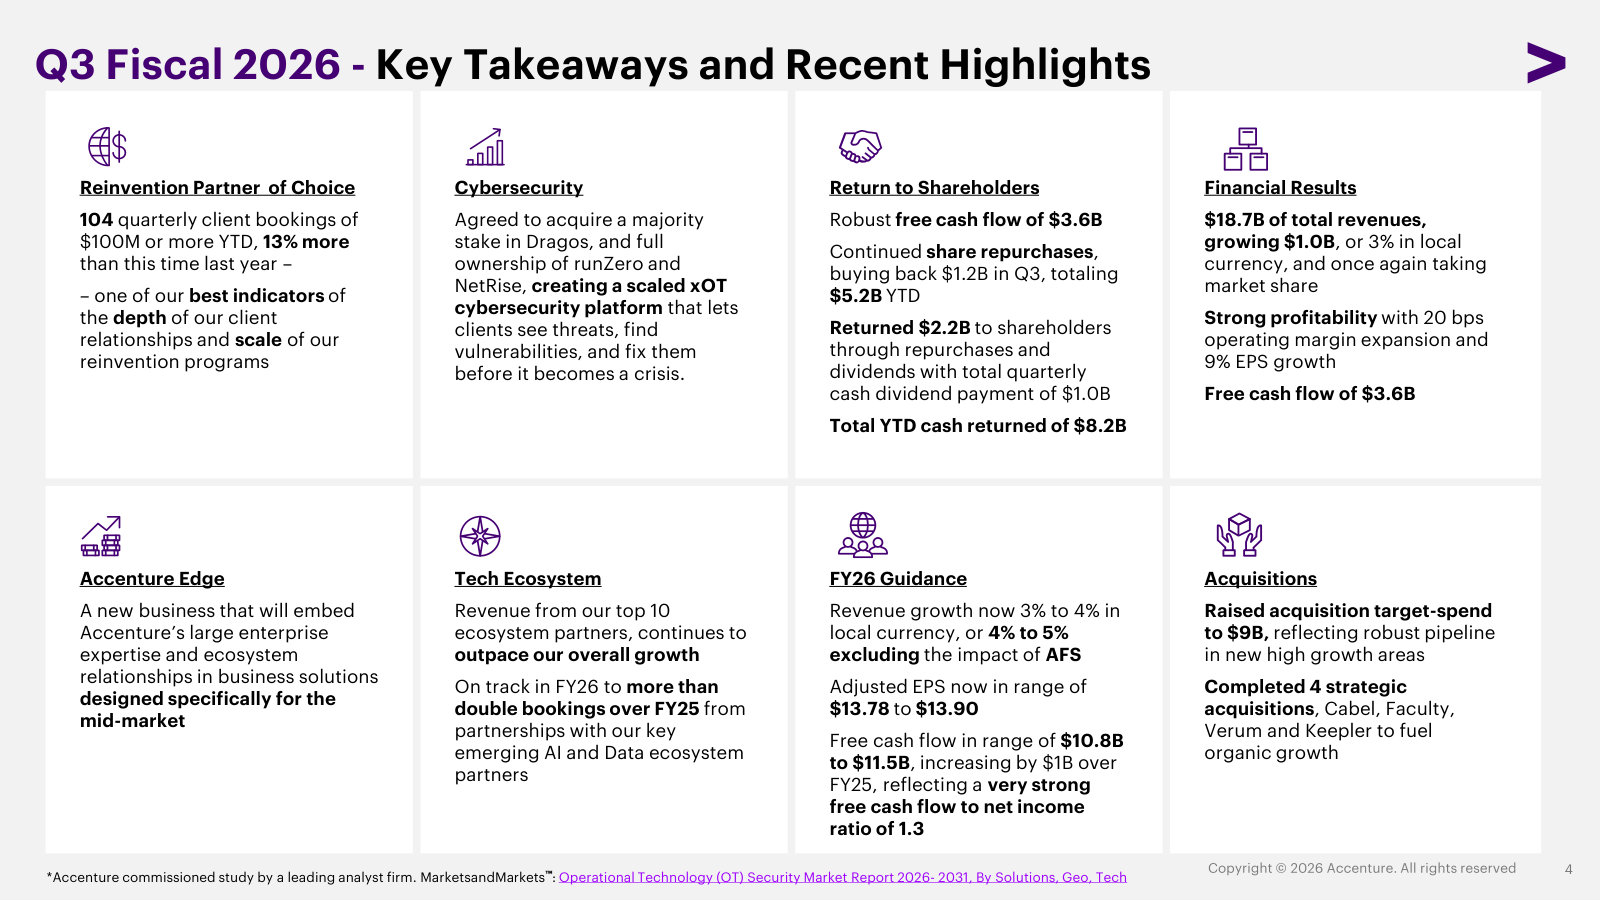
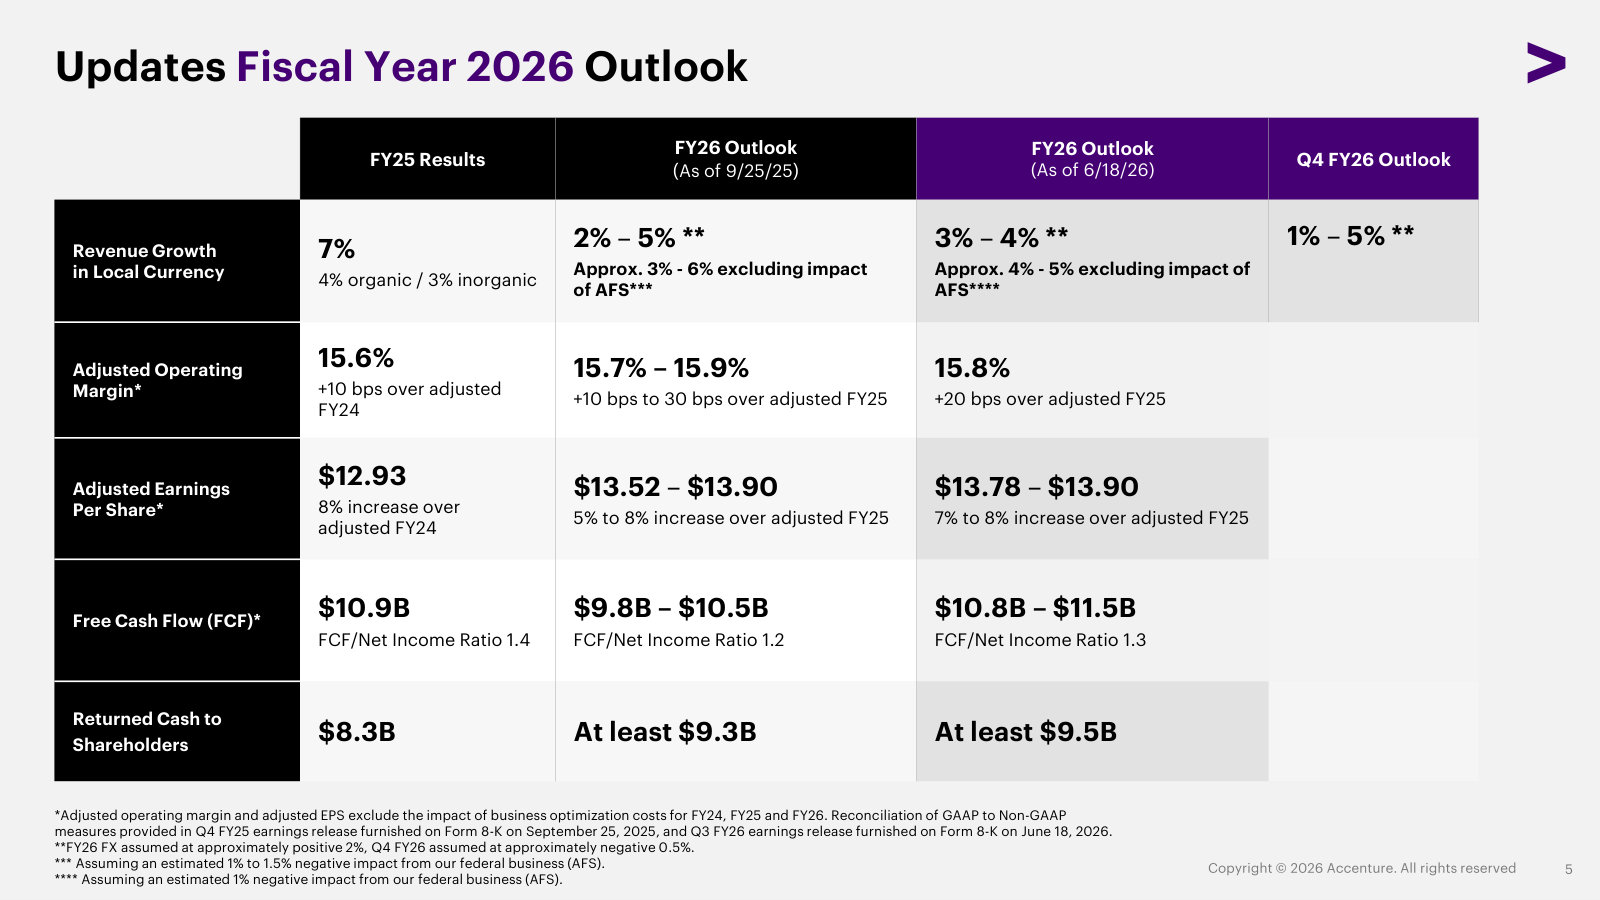
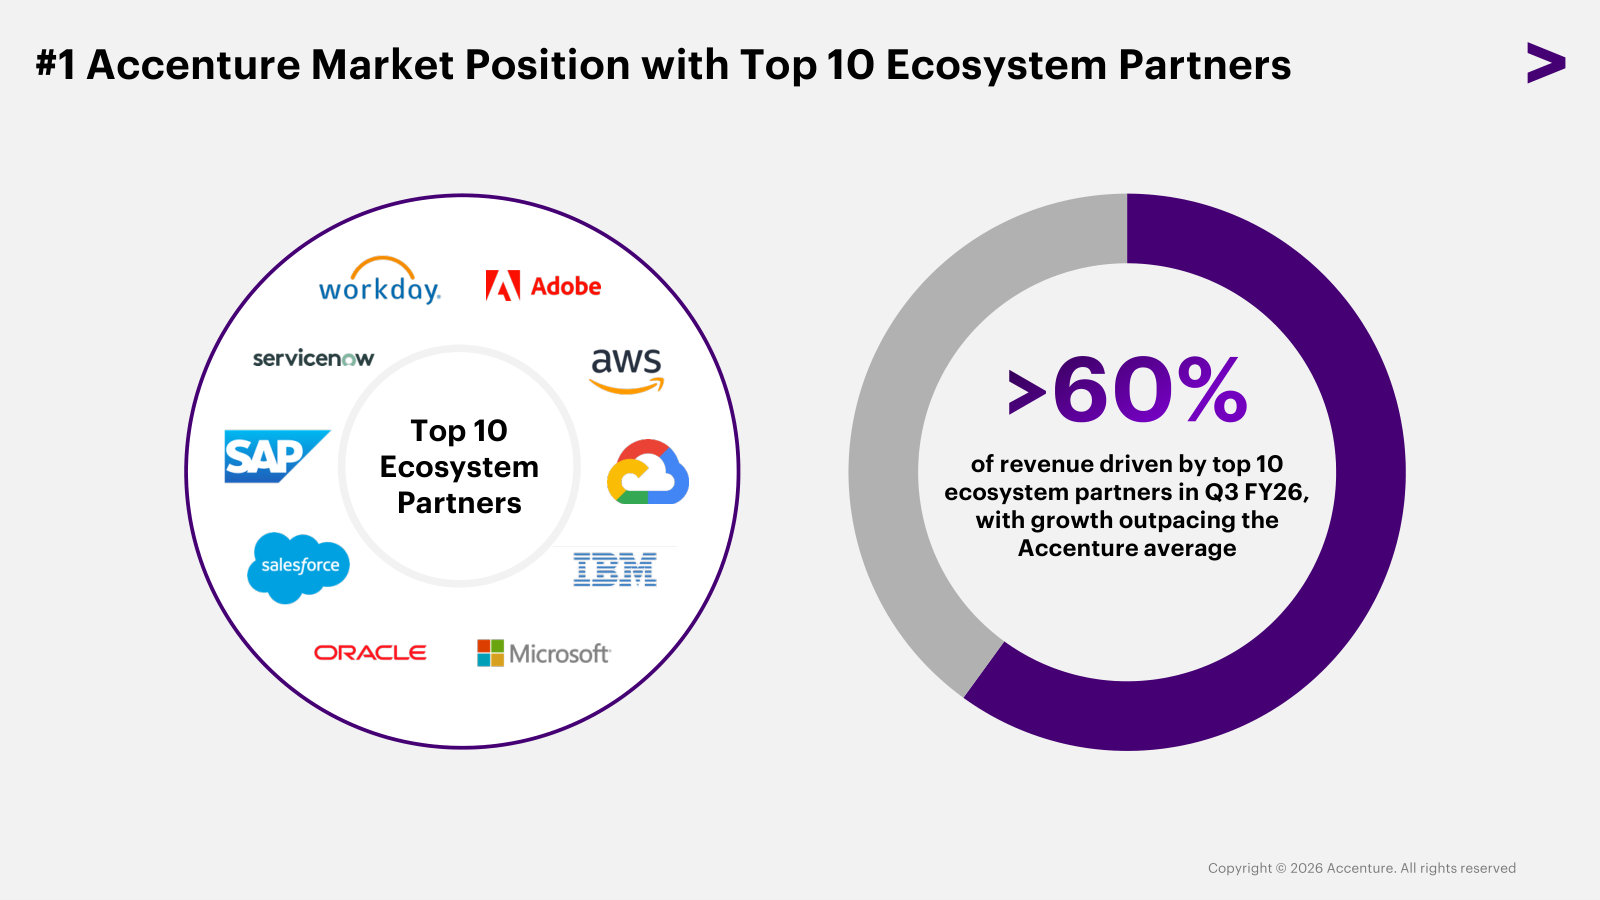
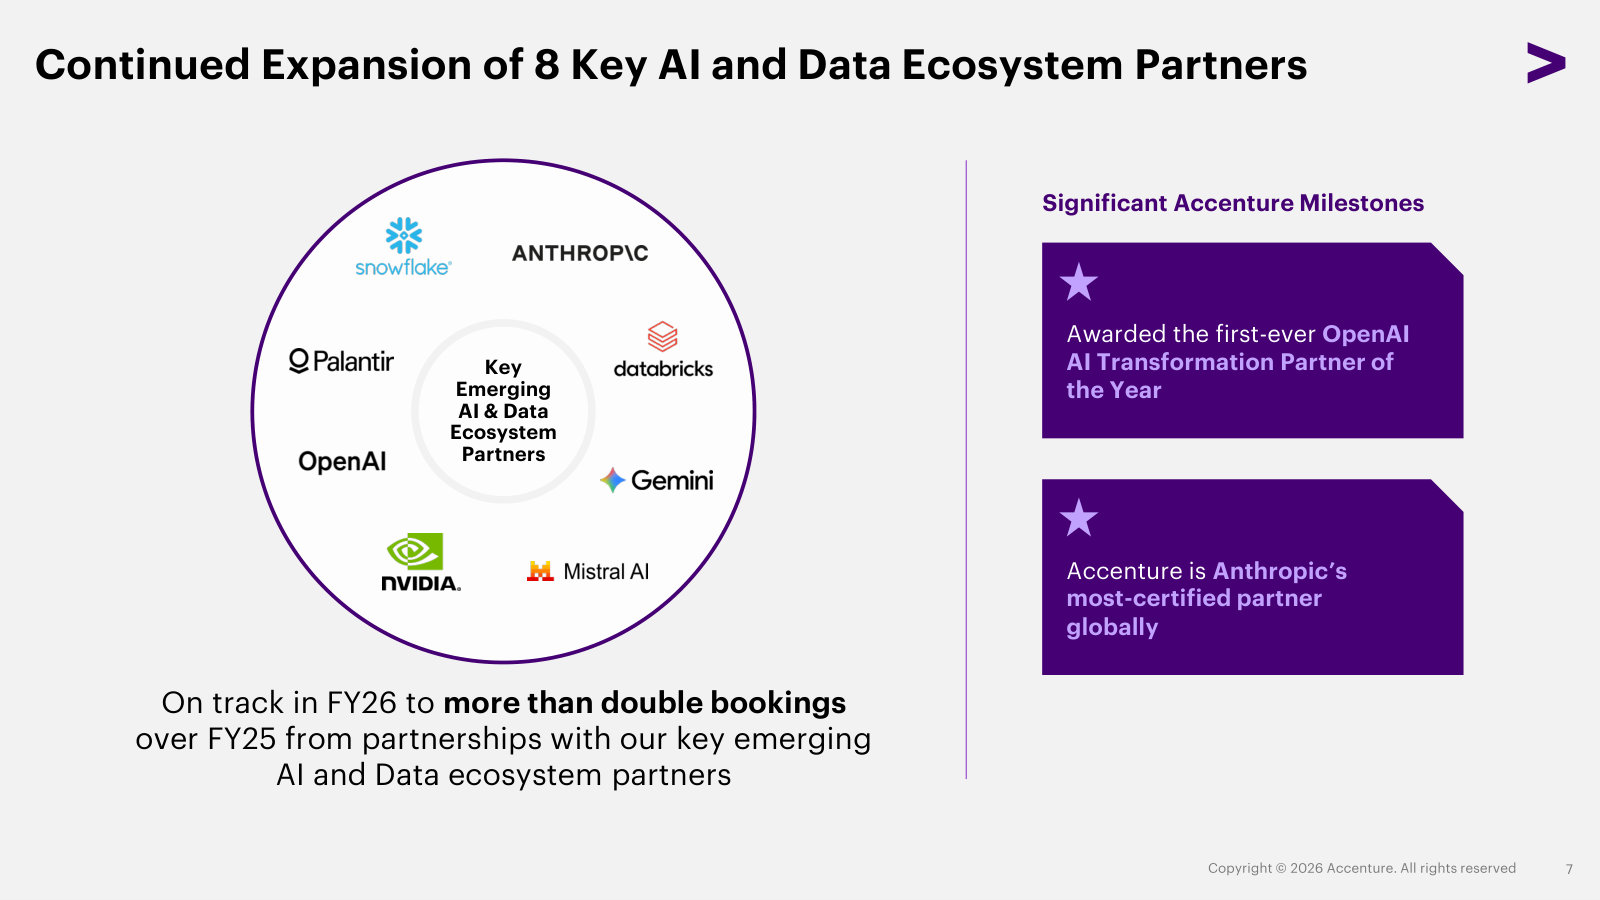
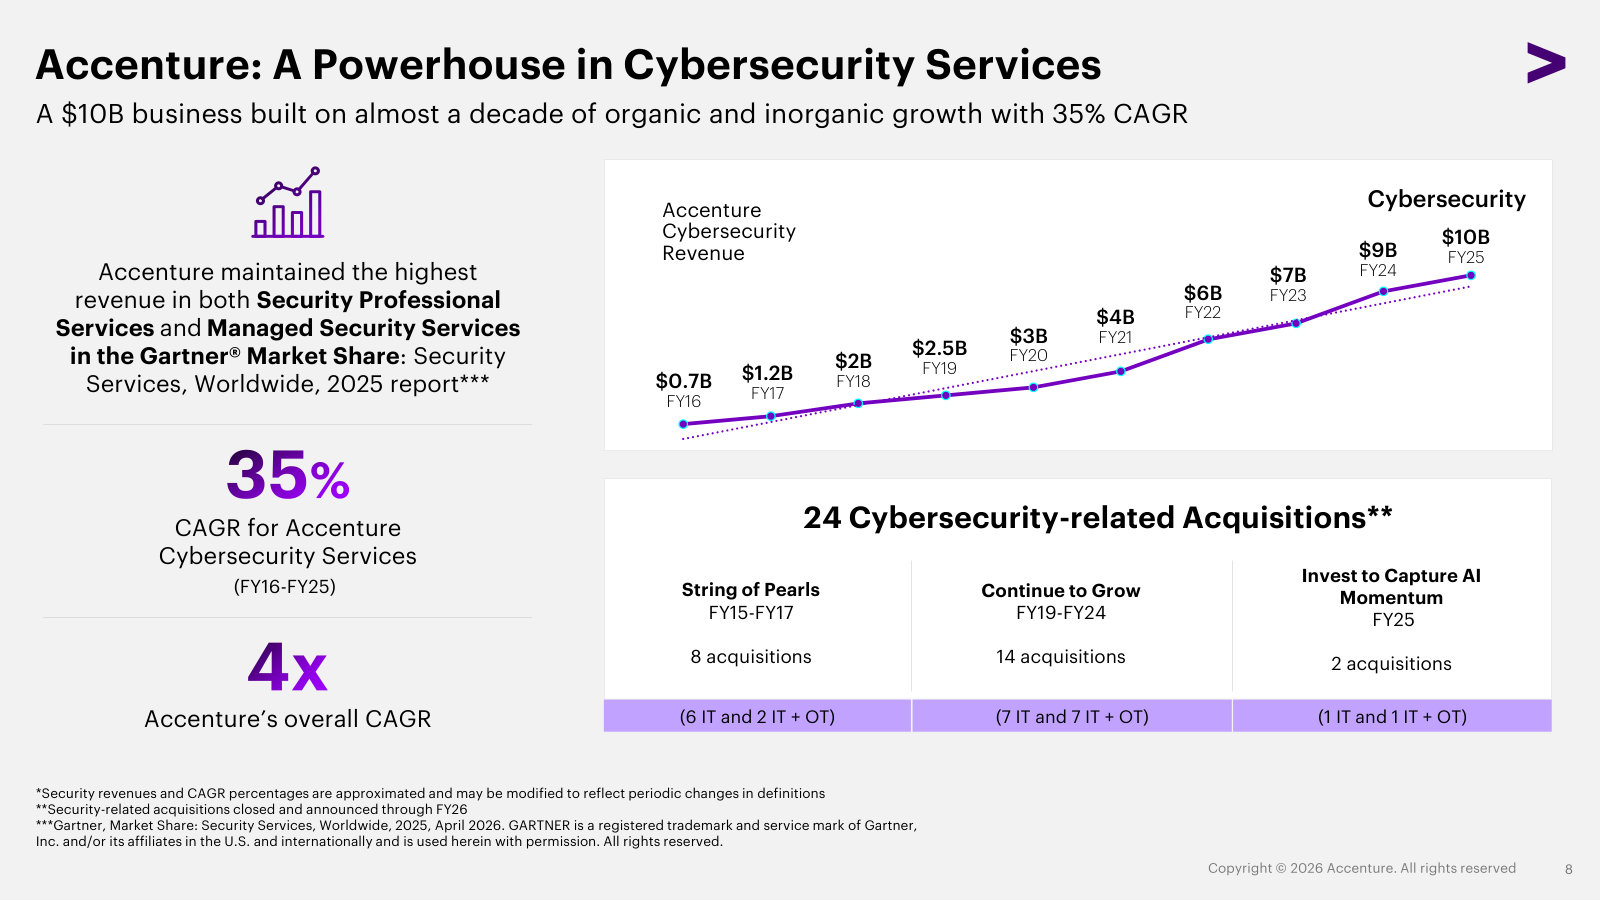
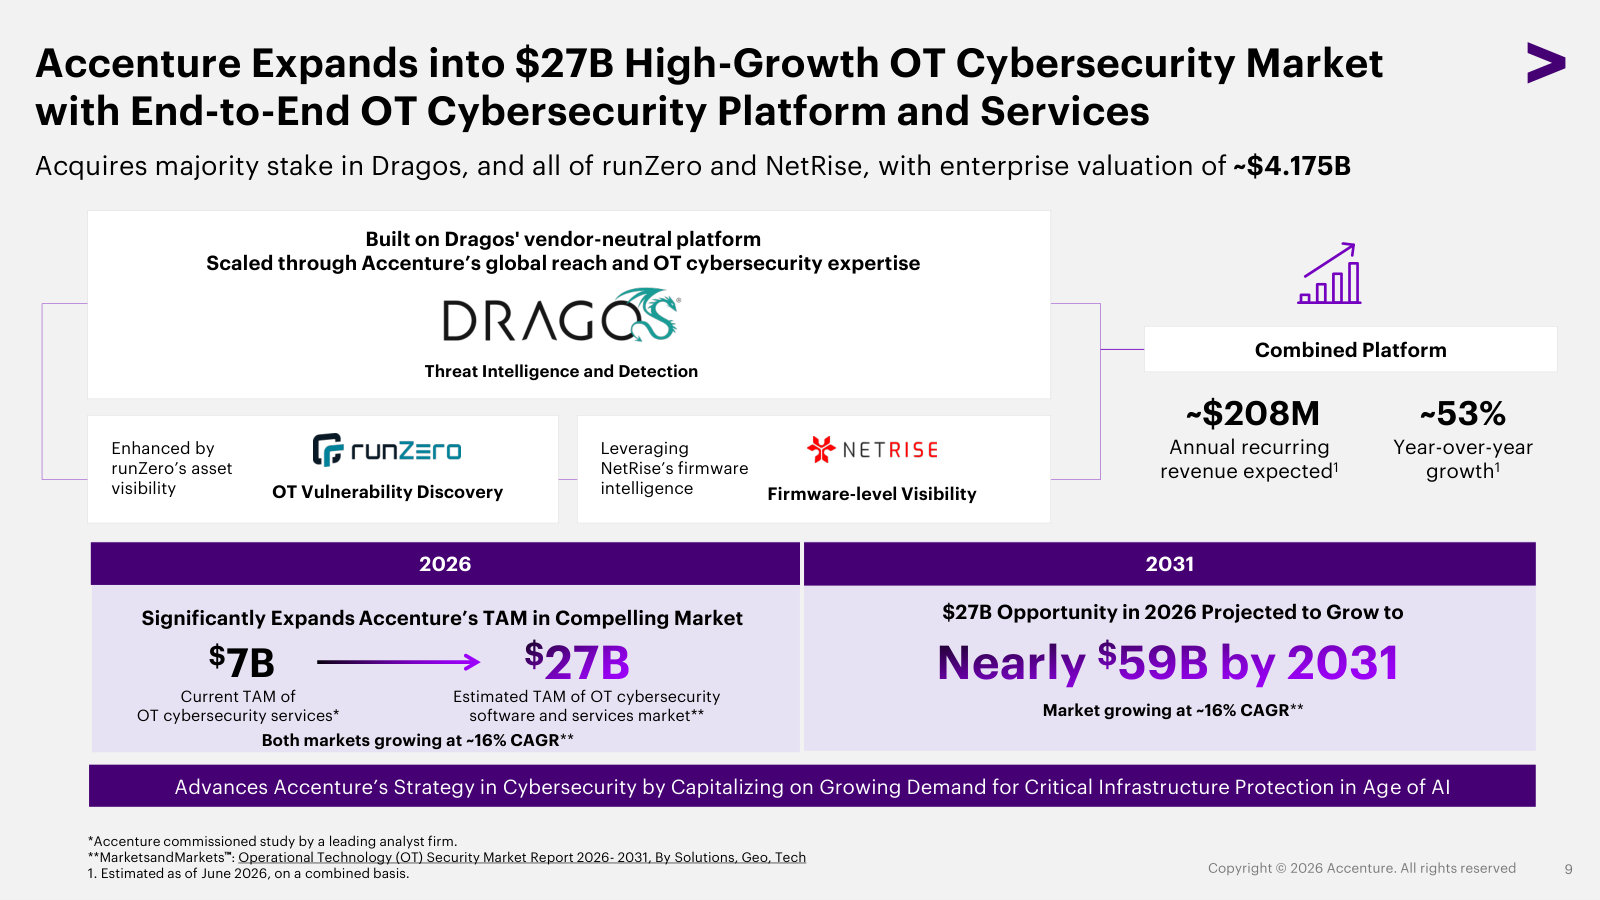
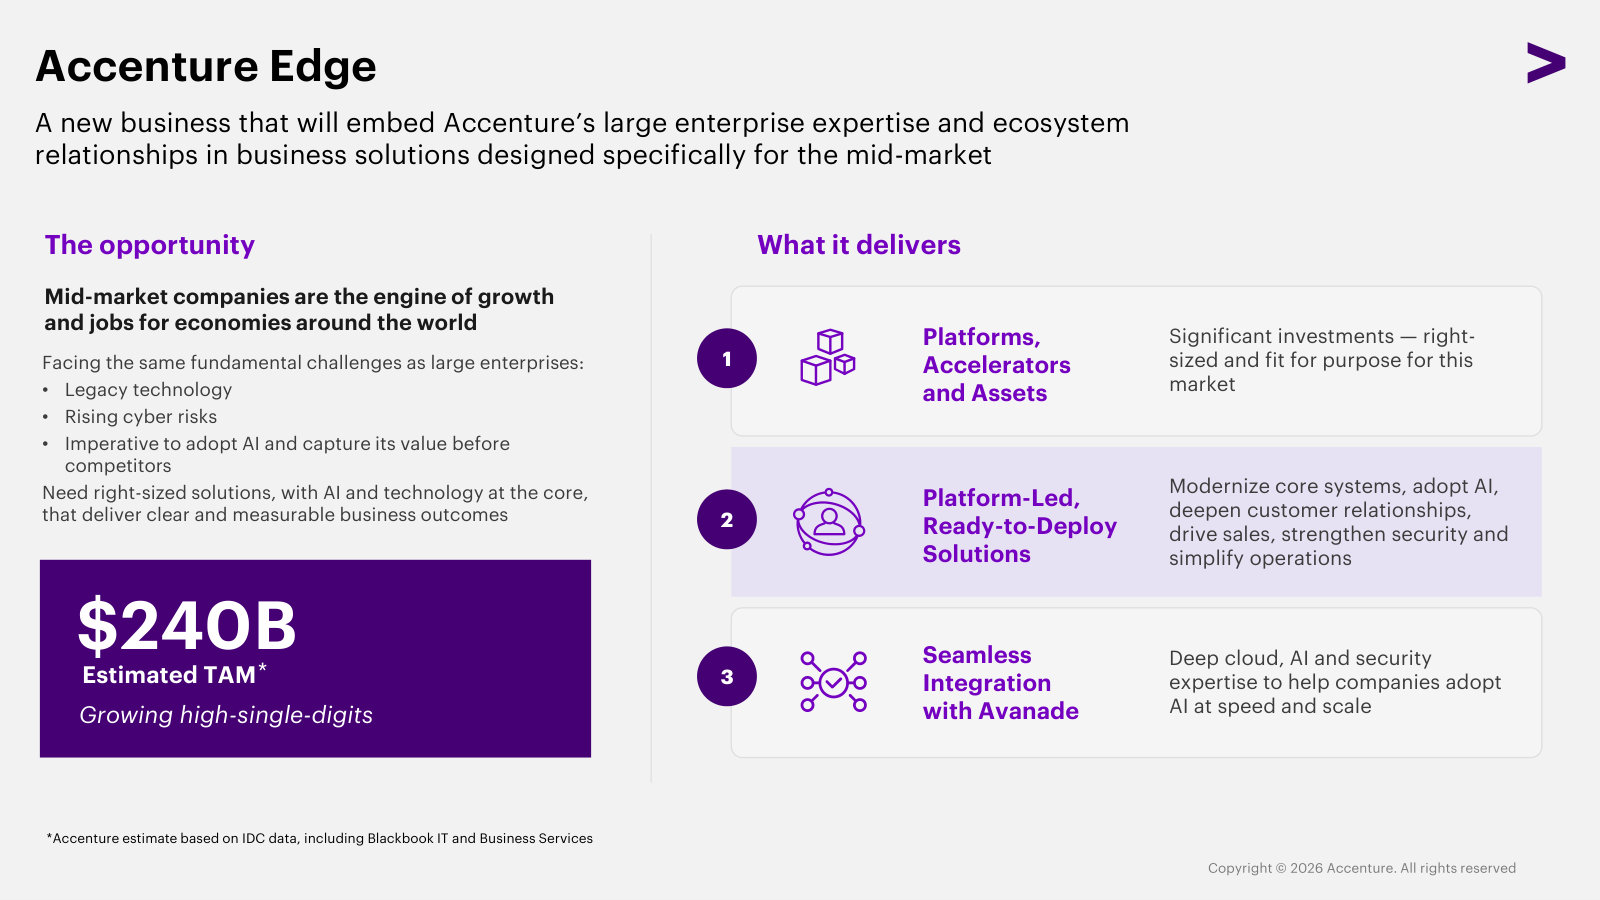
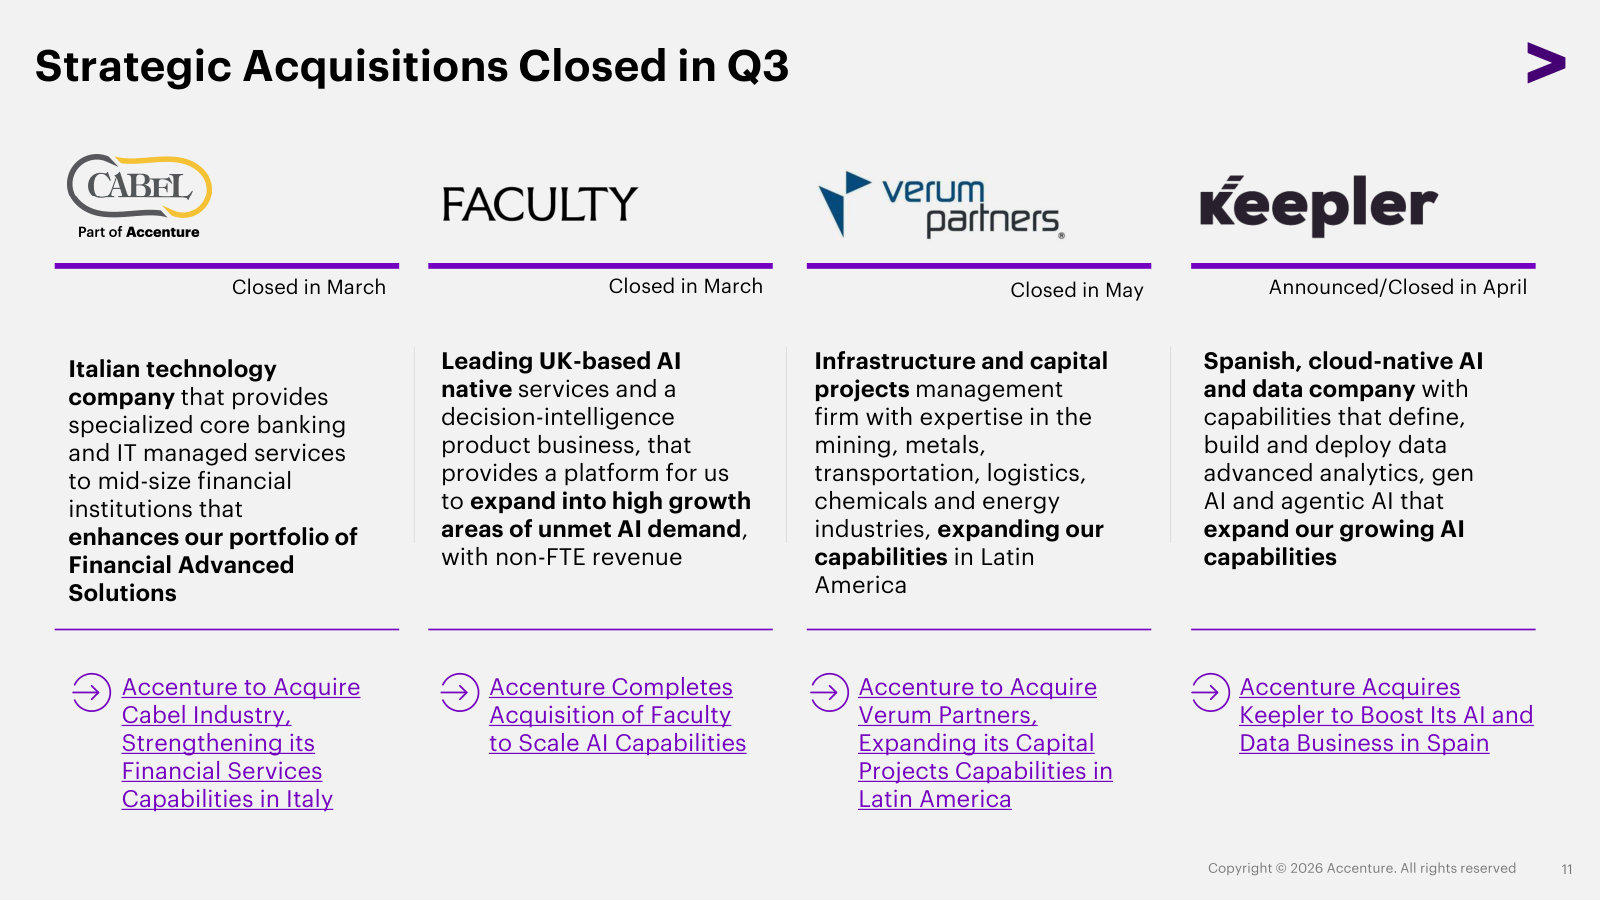
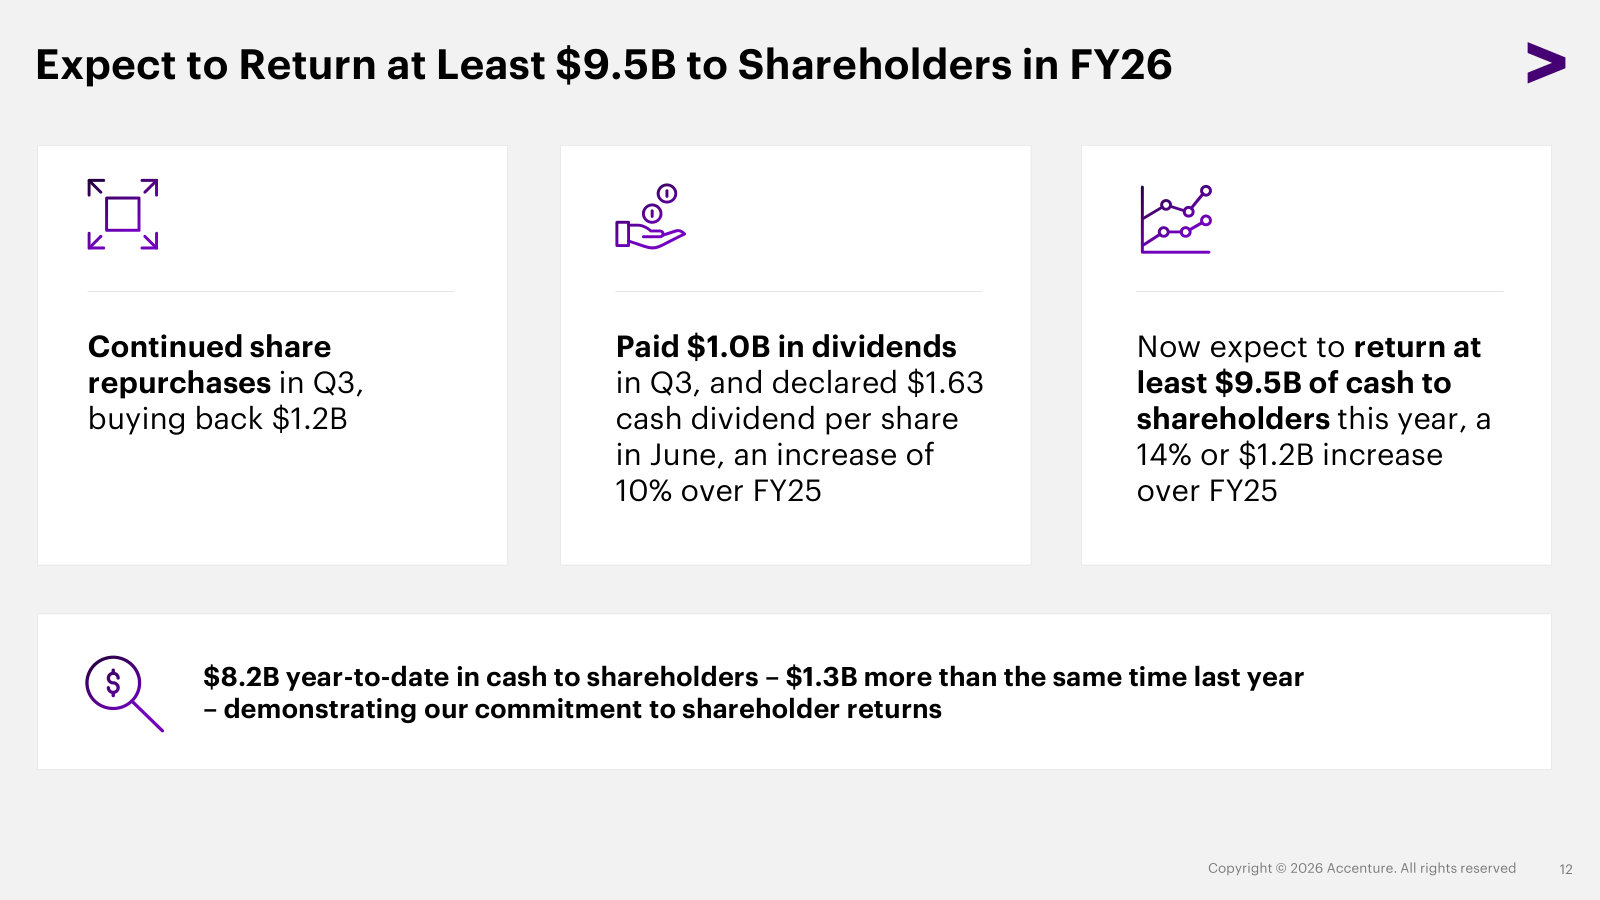
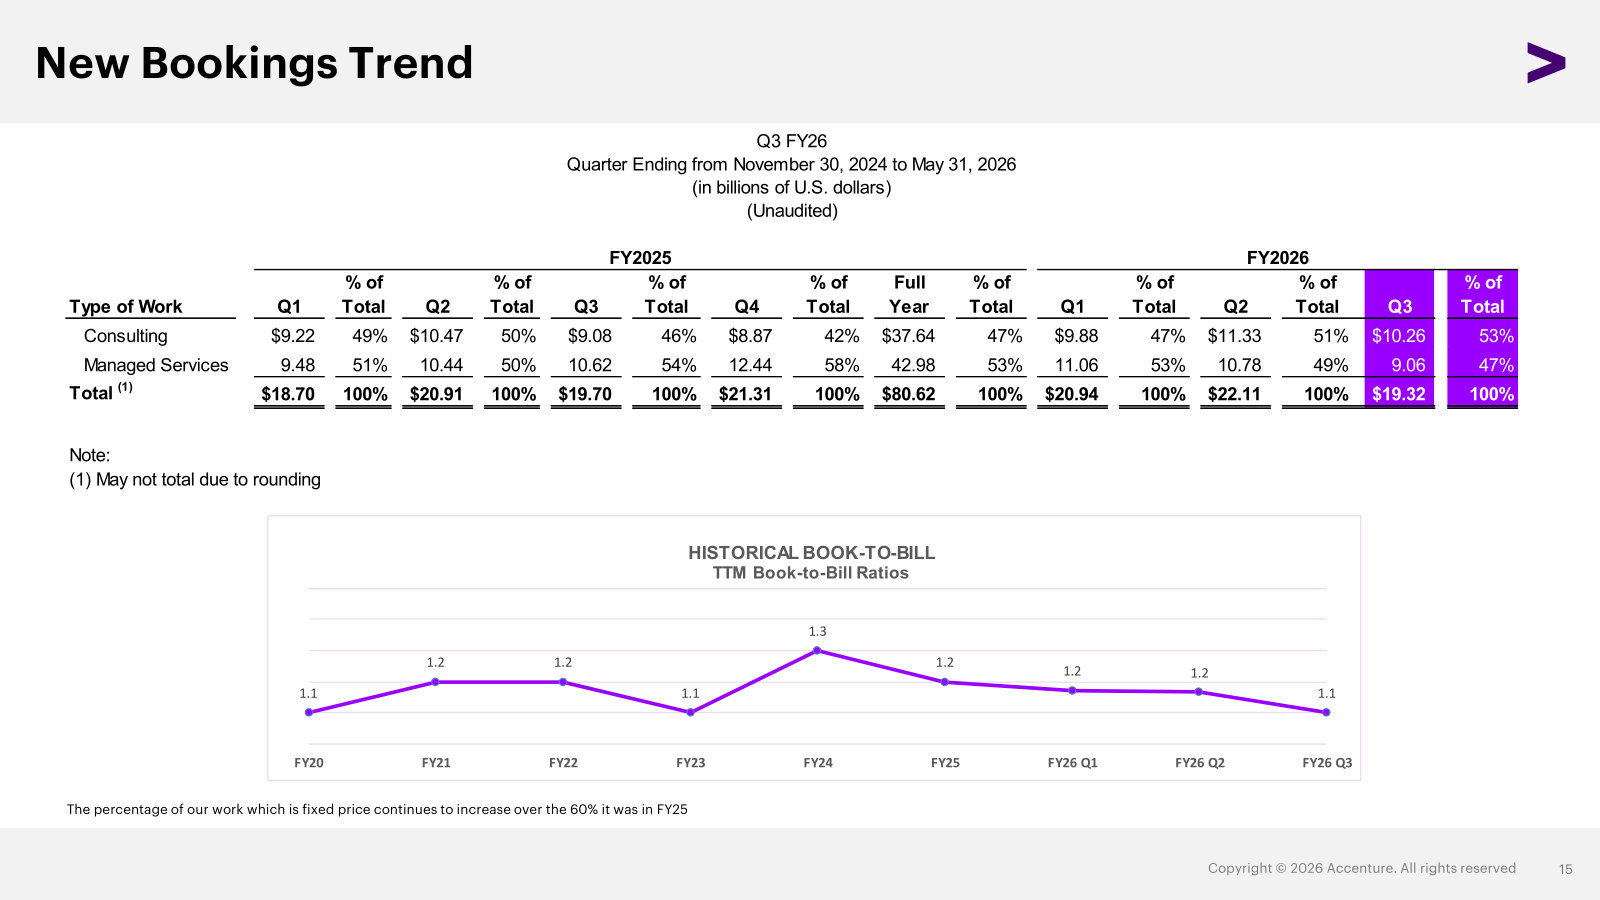
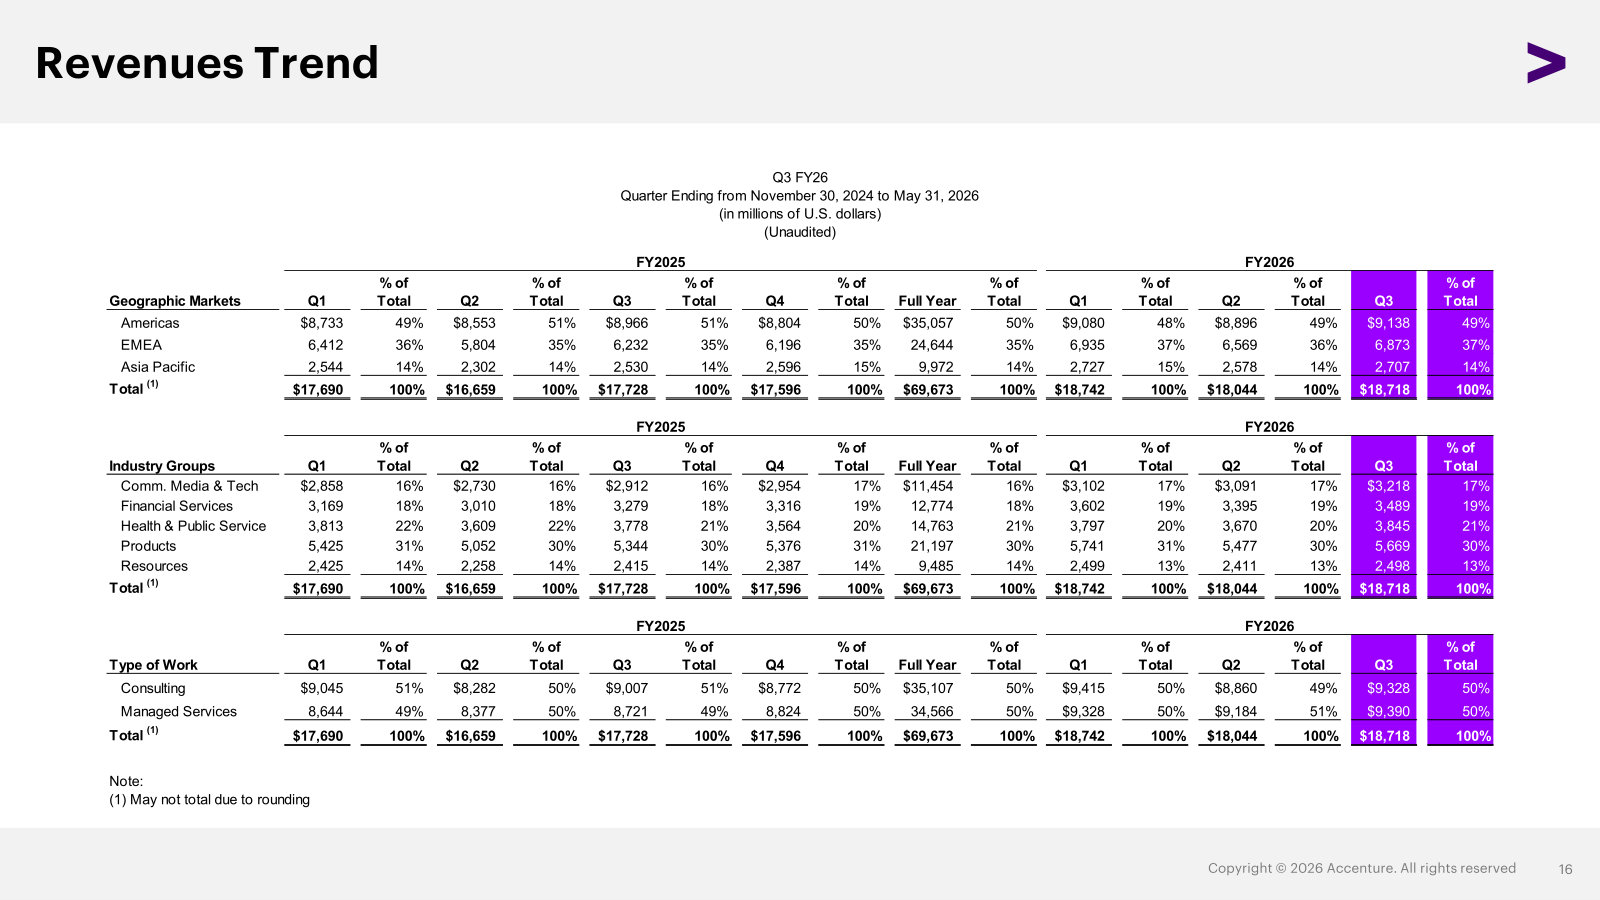
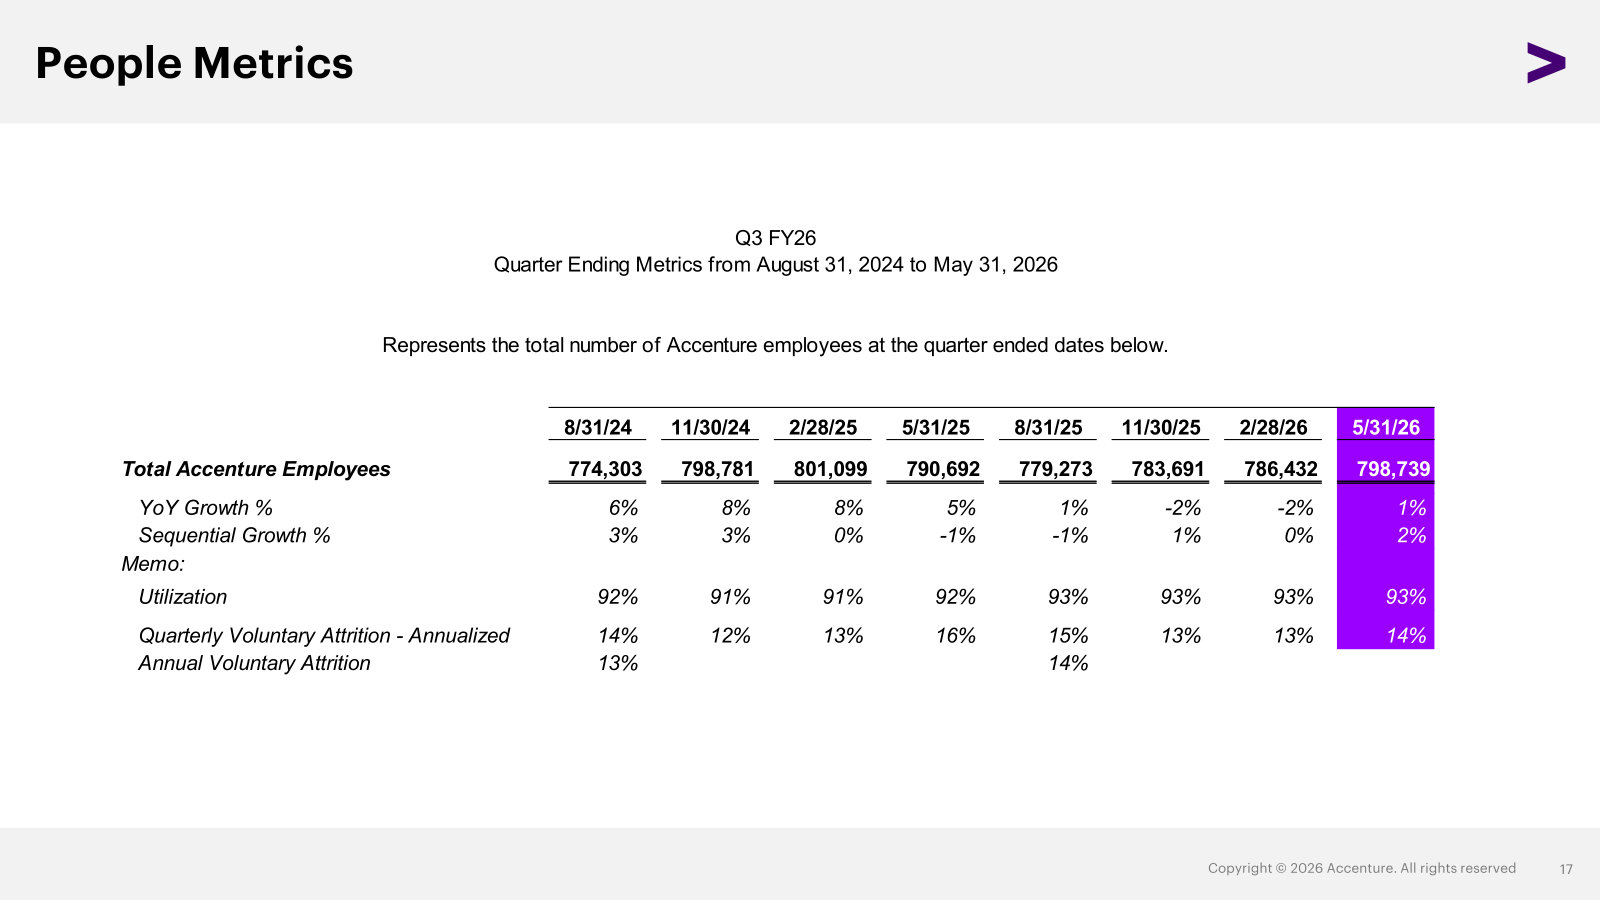
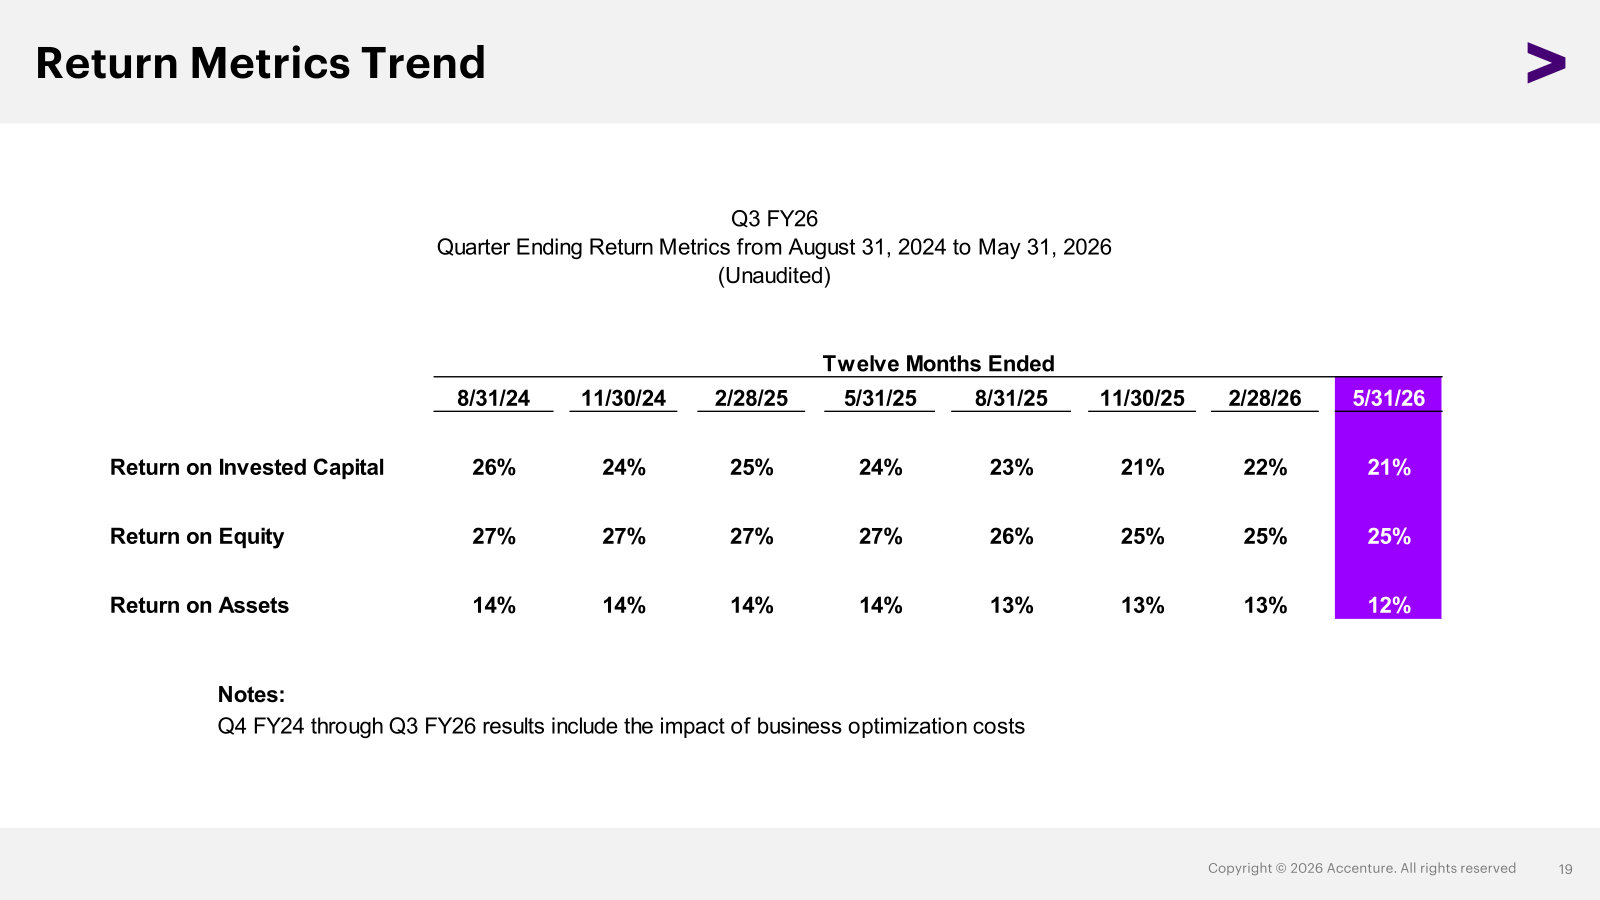
Q2 FY2026 Earnings Presentation — Q2 FY2026
Featured for two exhibits the other decks don't carry: the first-half acquisitions and the analyst-ranking map of the competitive field. · Open the full document →
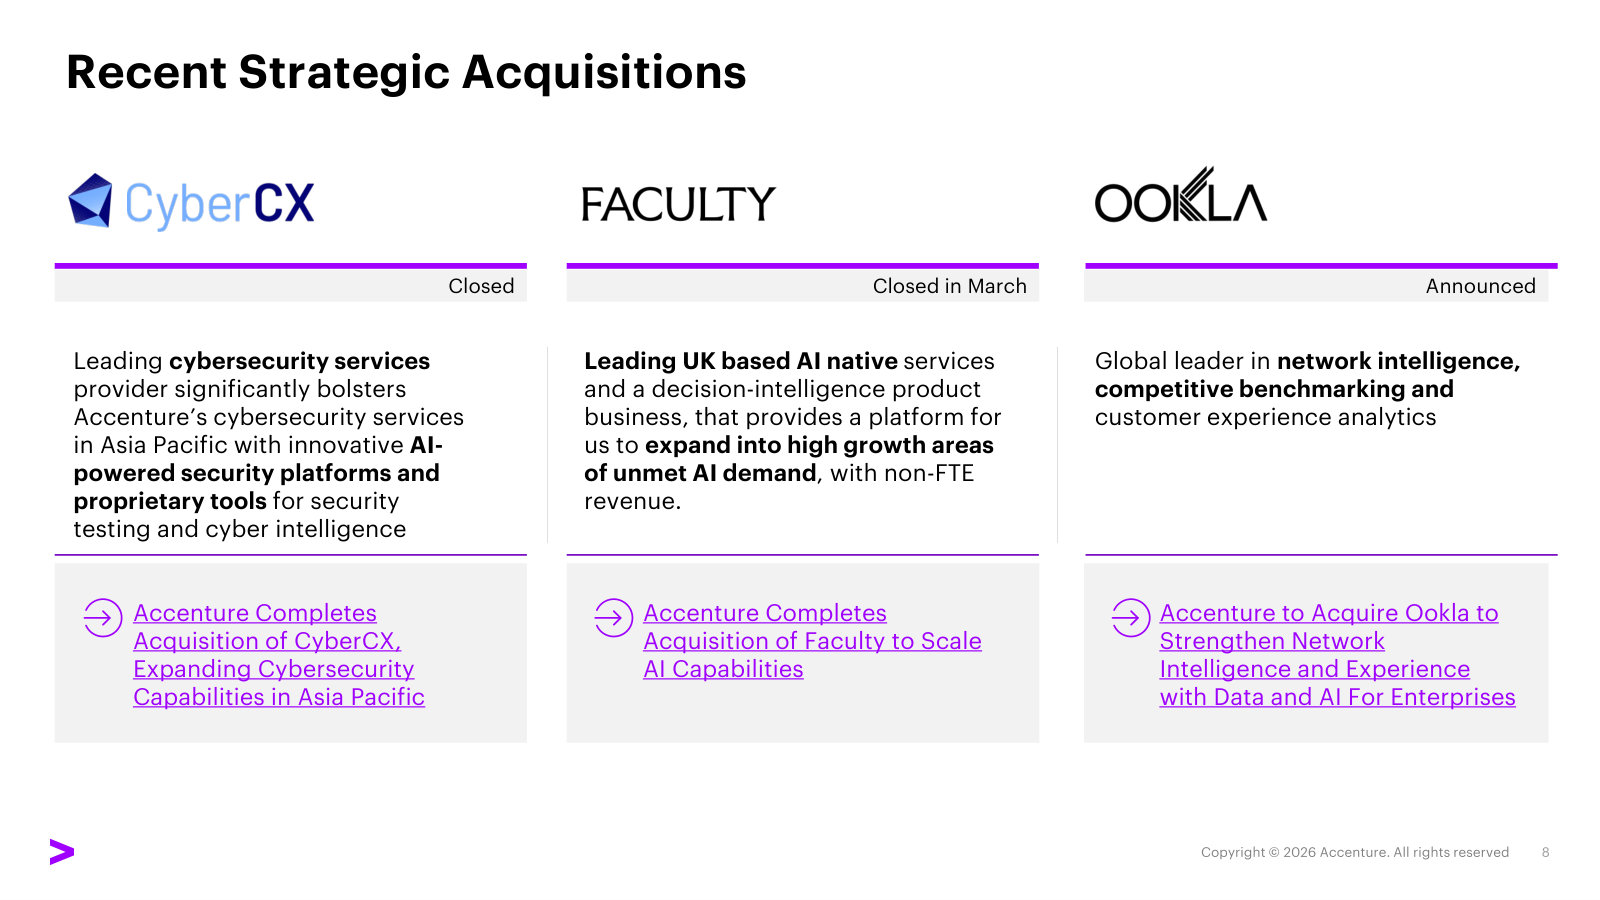
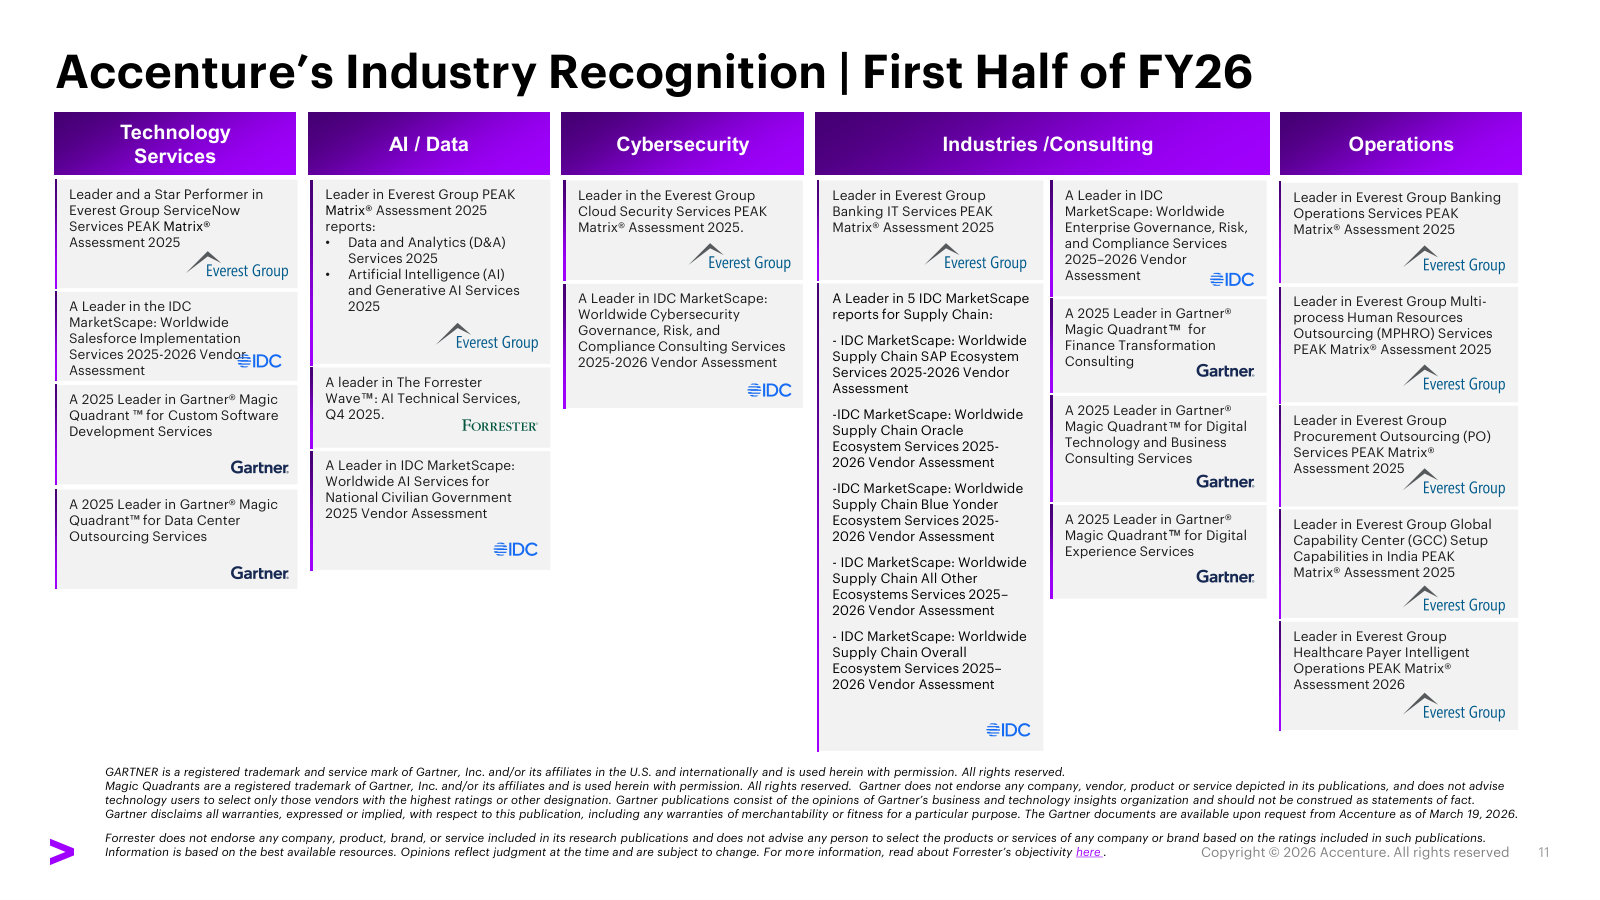
Q1 FY2026 Earnings Presentation — Q1 FY2026
Three structural explainers found nowhere else here: the shift to fixed price, the scale of advanced AI, and what Song actually is. · Open the full document →
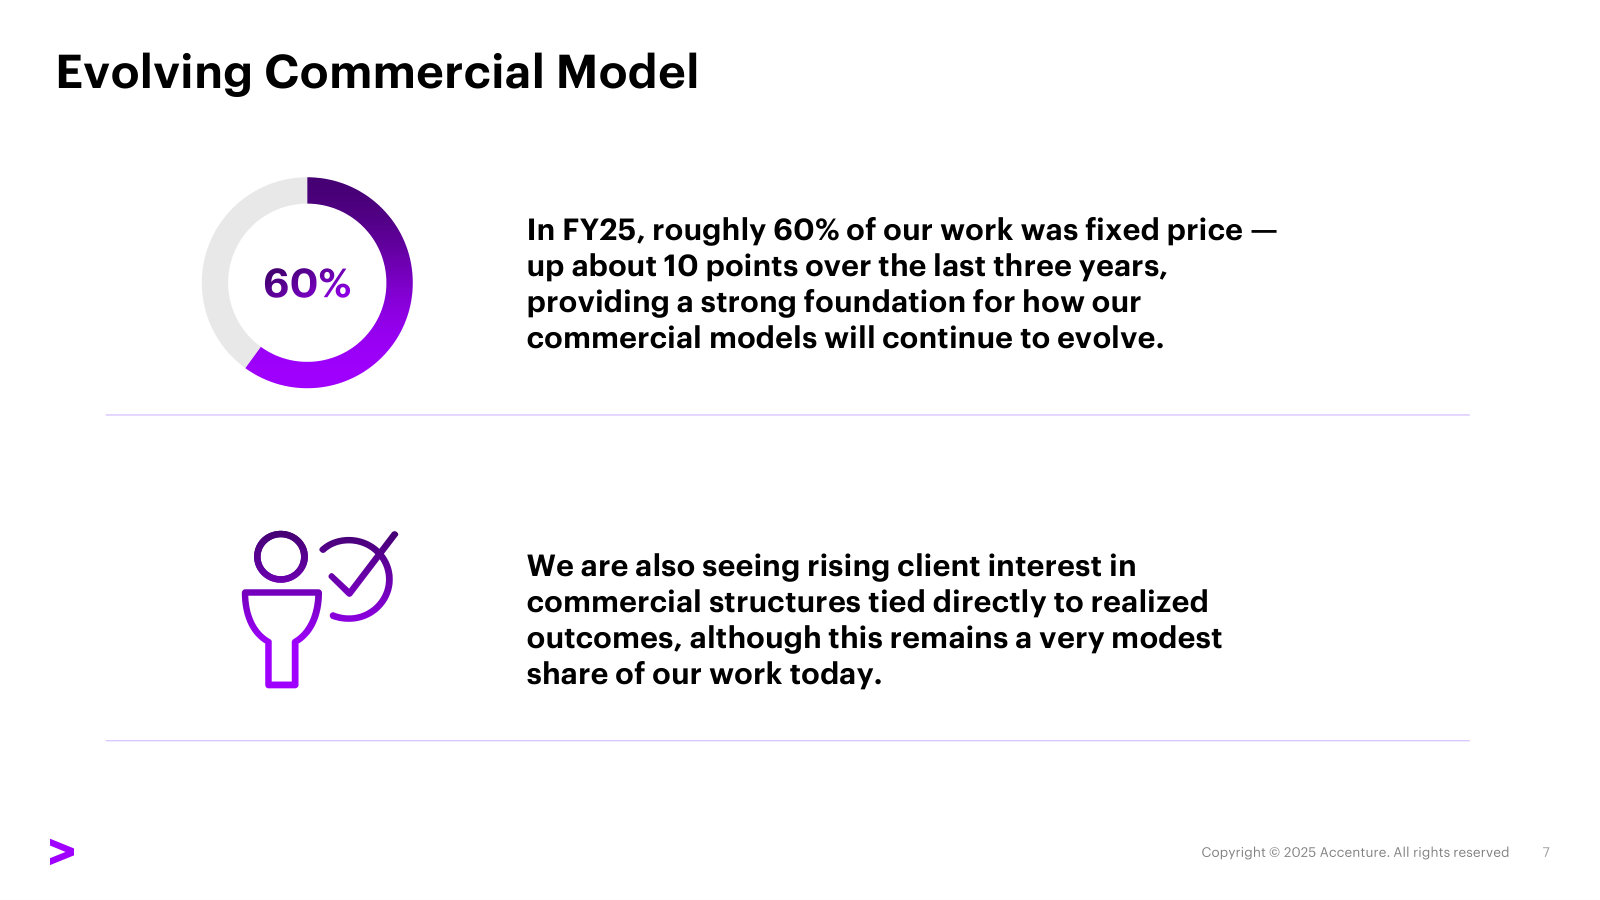
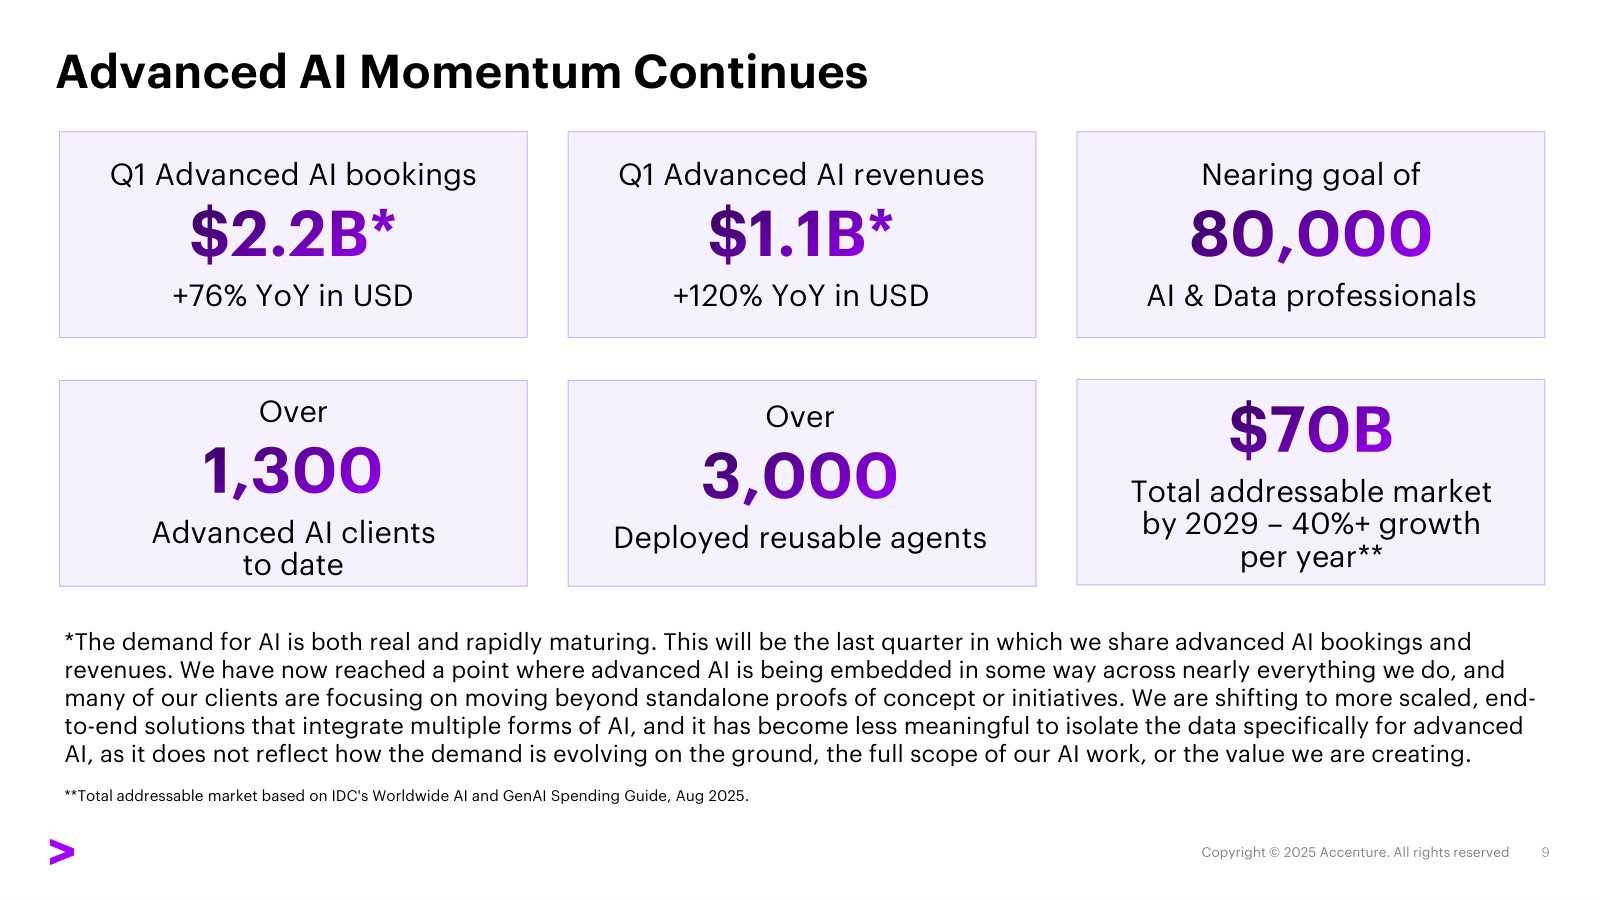
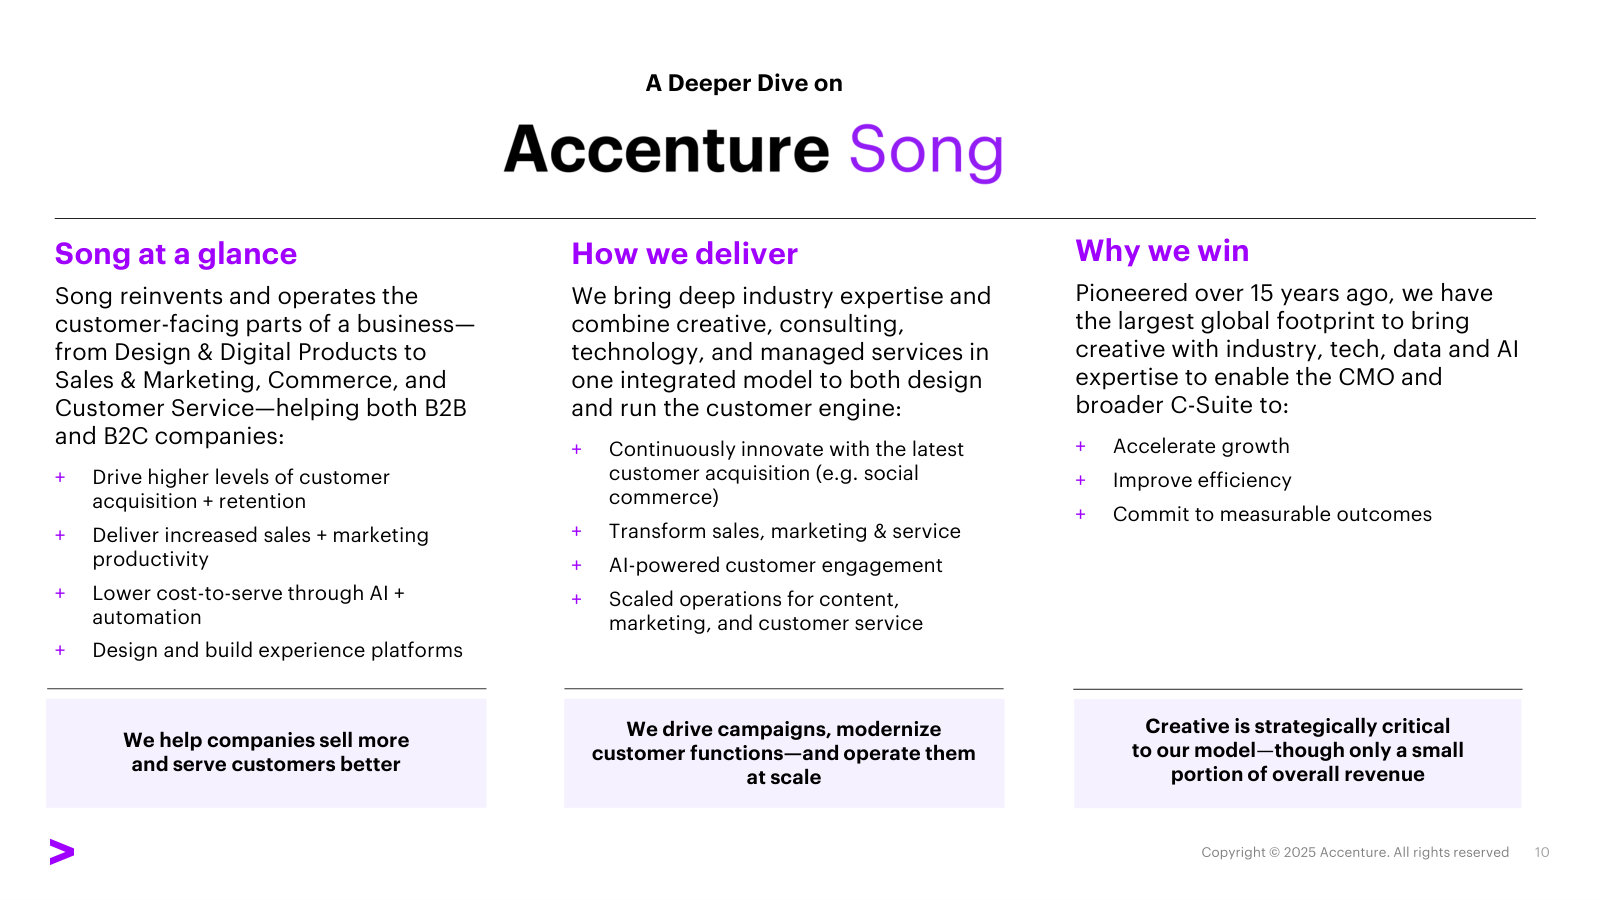
Q4 and Full-Year FY2025 Earnings Presentation — FY2025
The full-year deck: the cleanest annual picture of the business, plus management's account of how it grows — AI, acquisitions, new lines. · Open the full document →
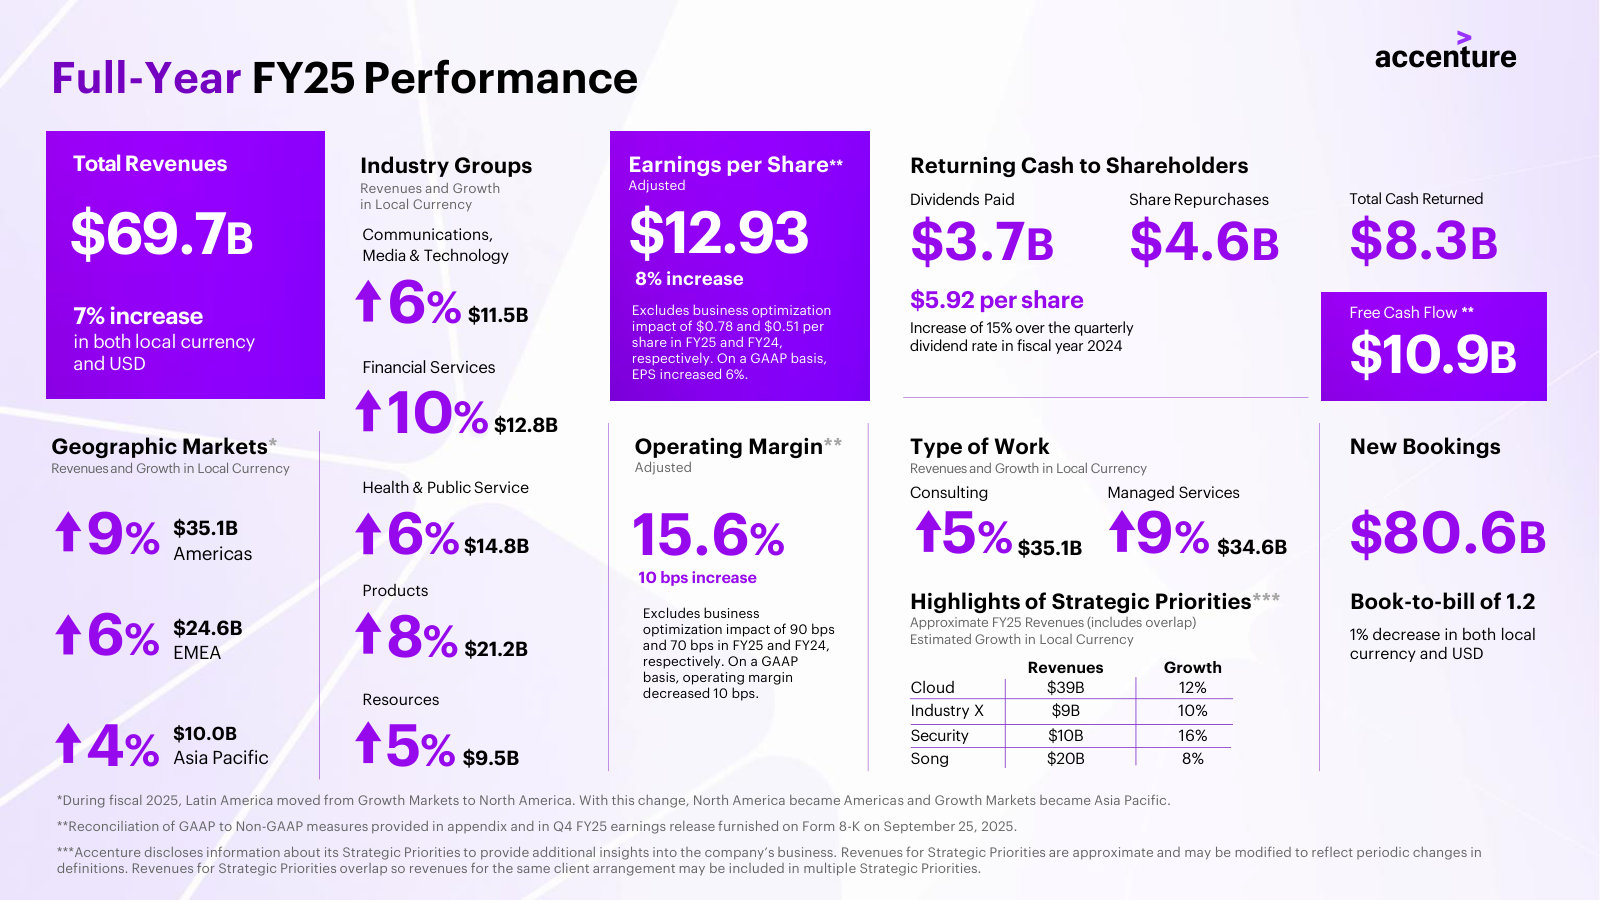
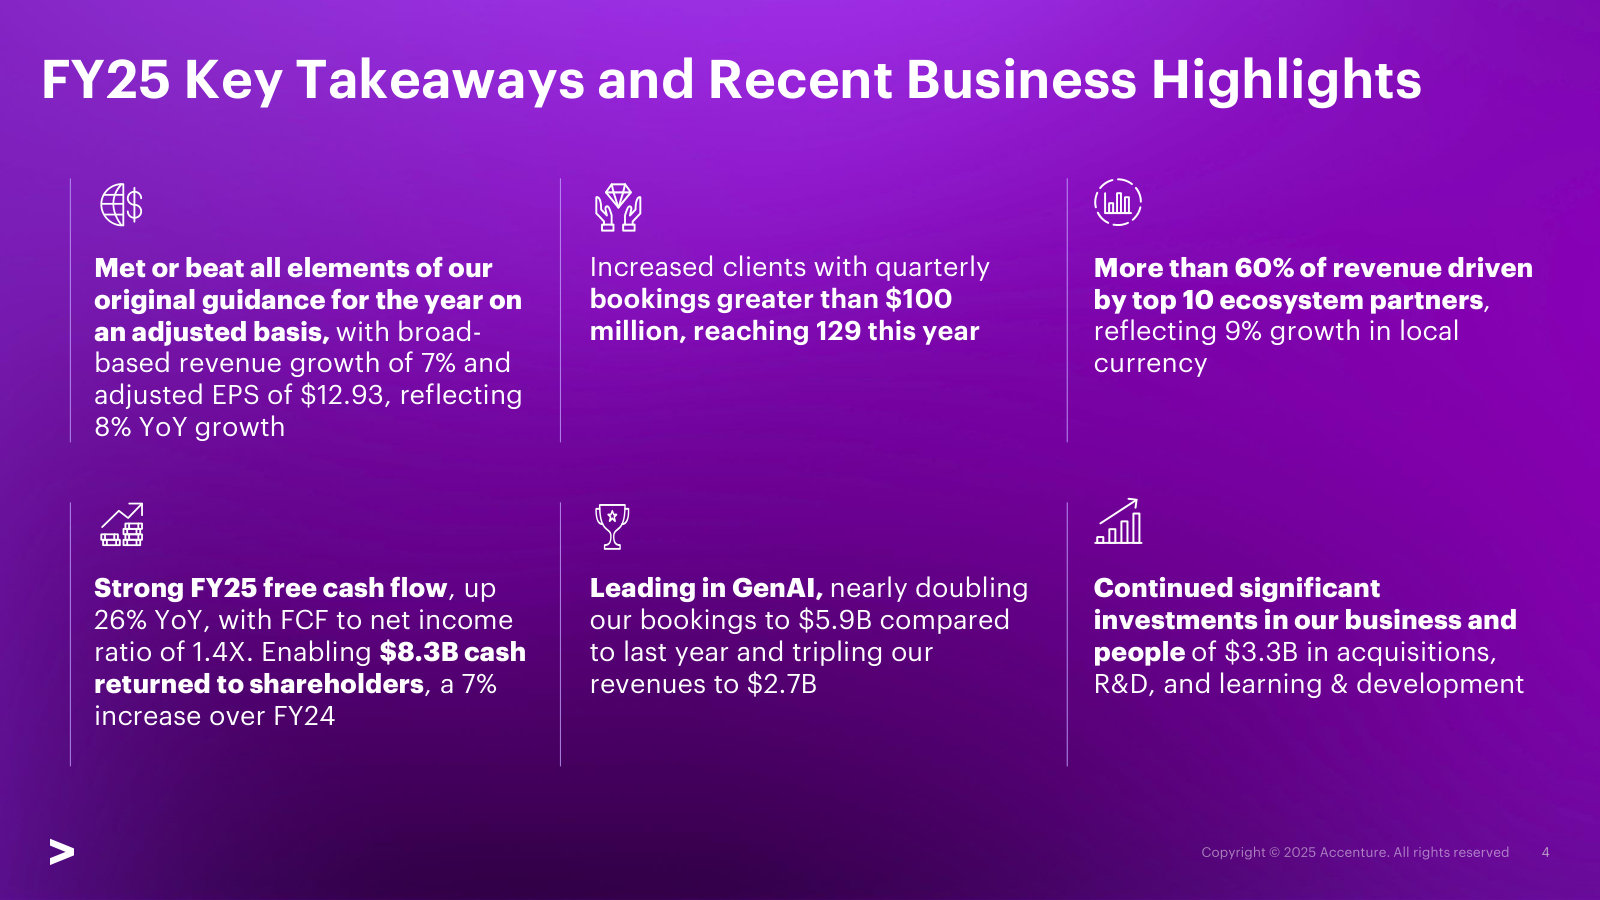
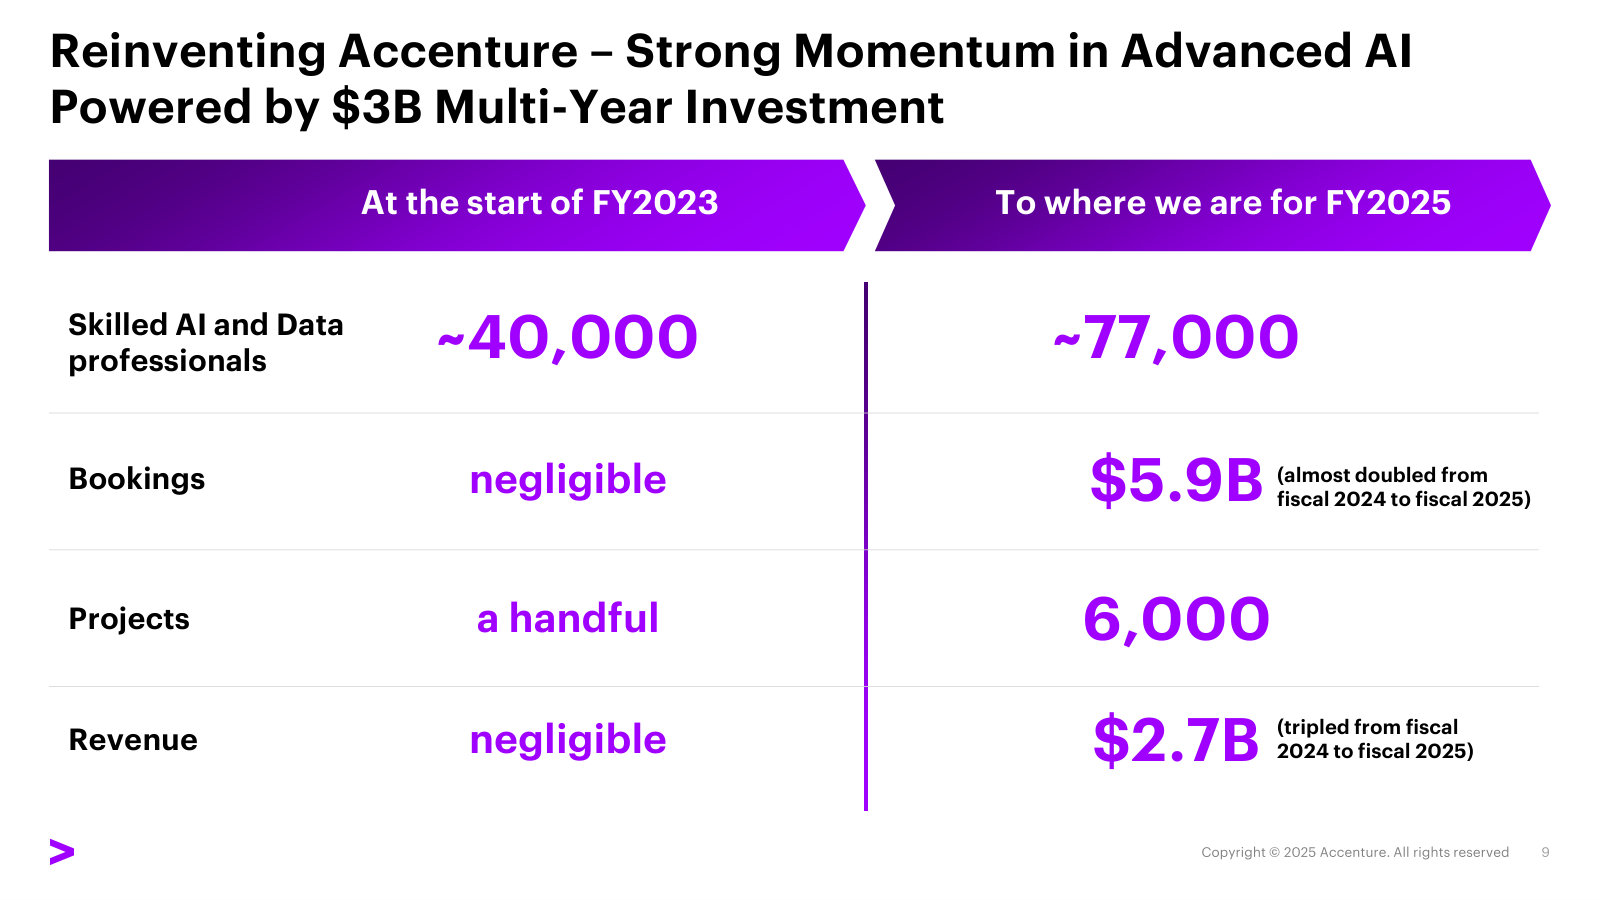
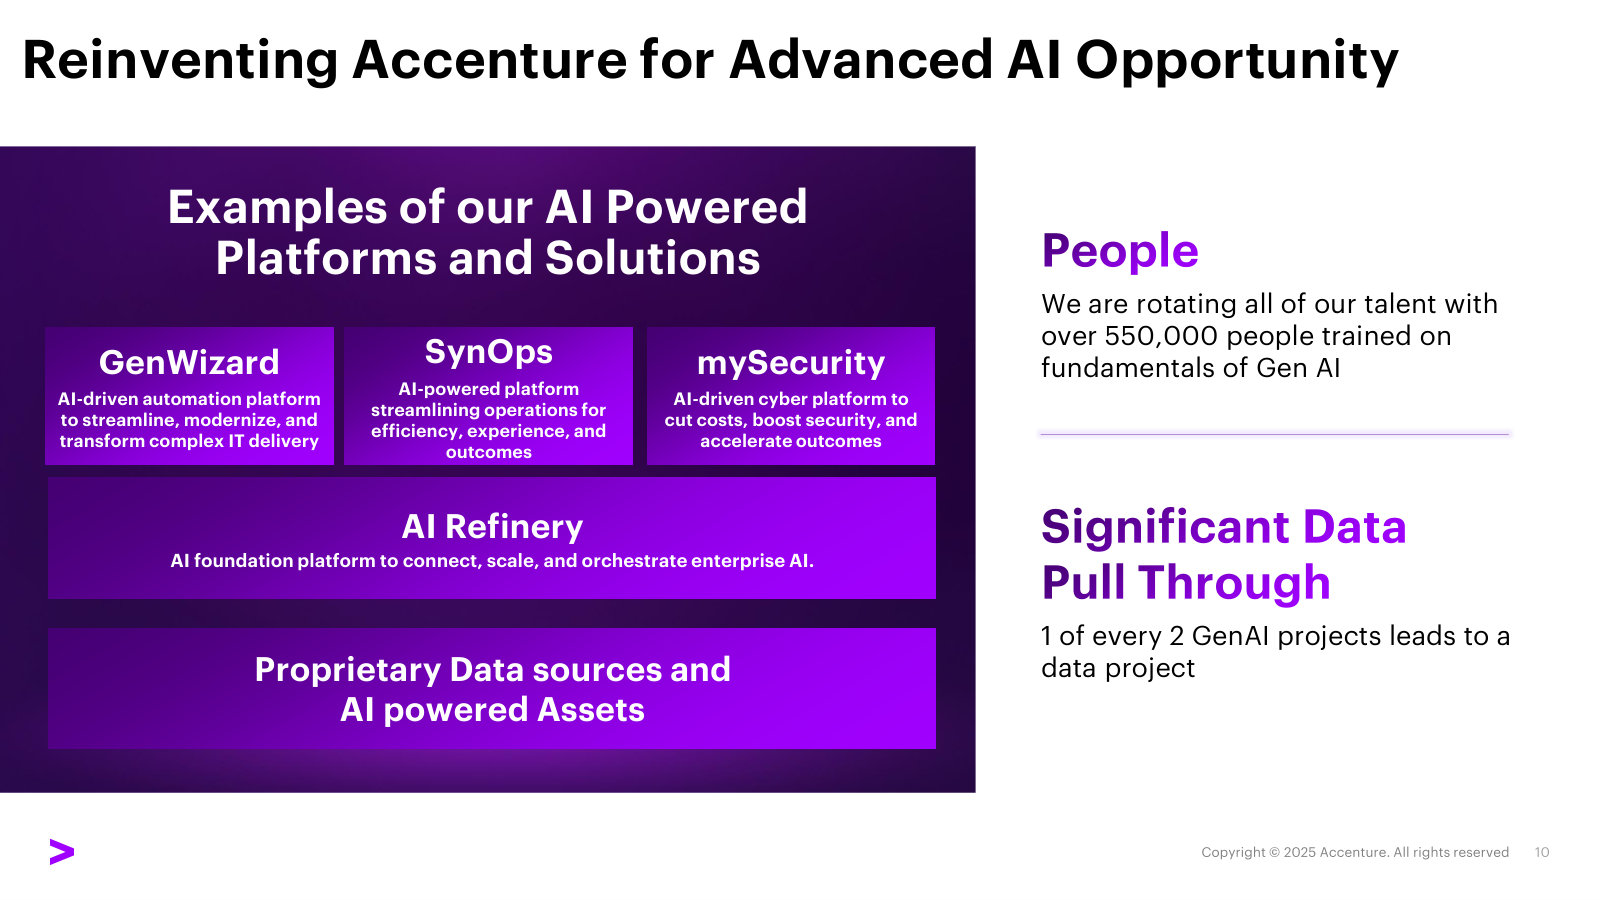
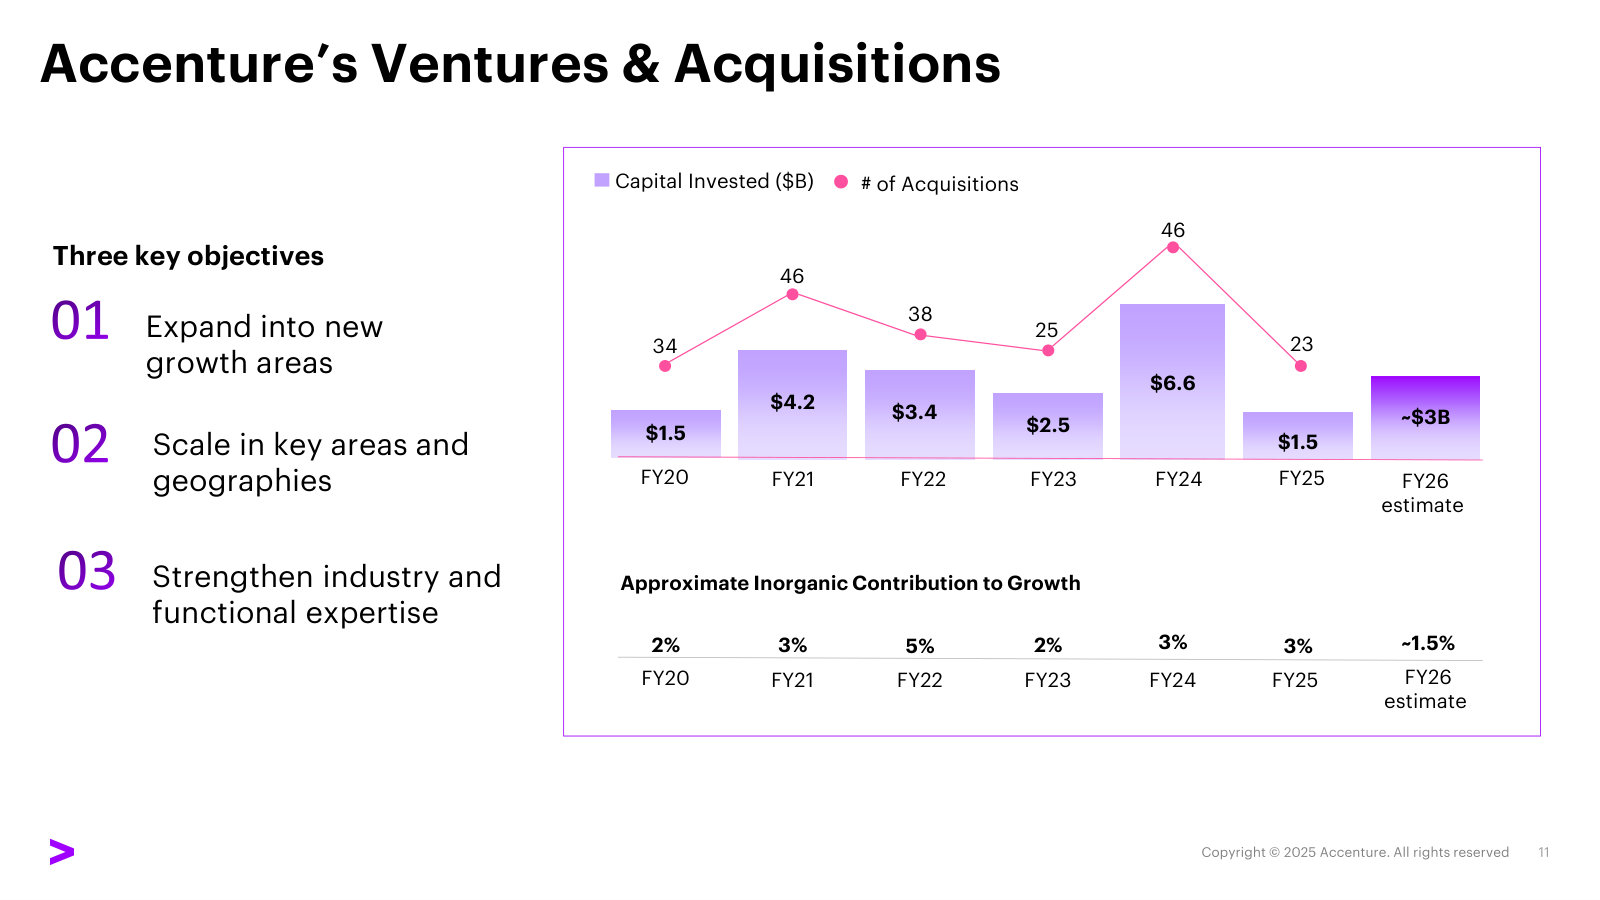
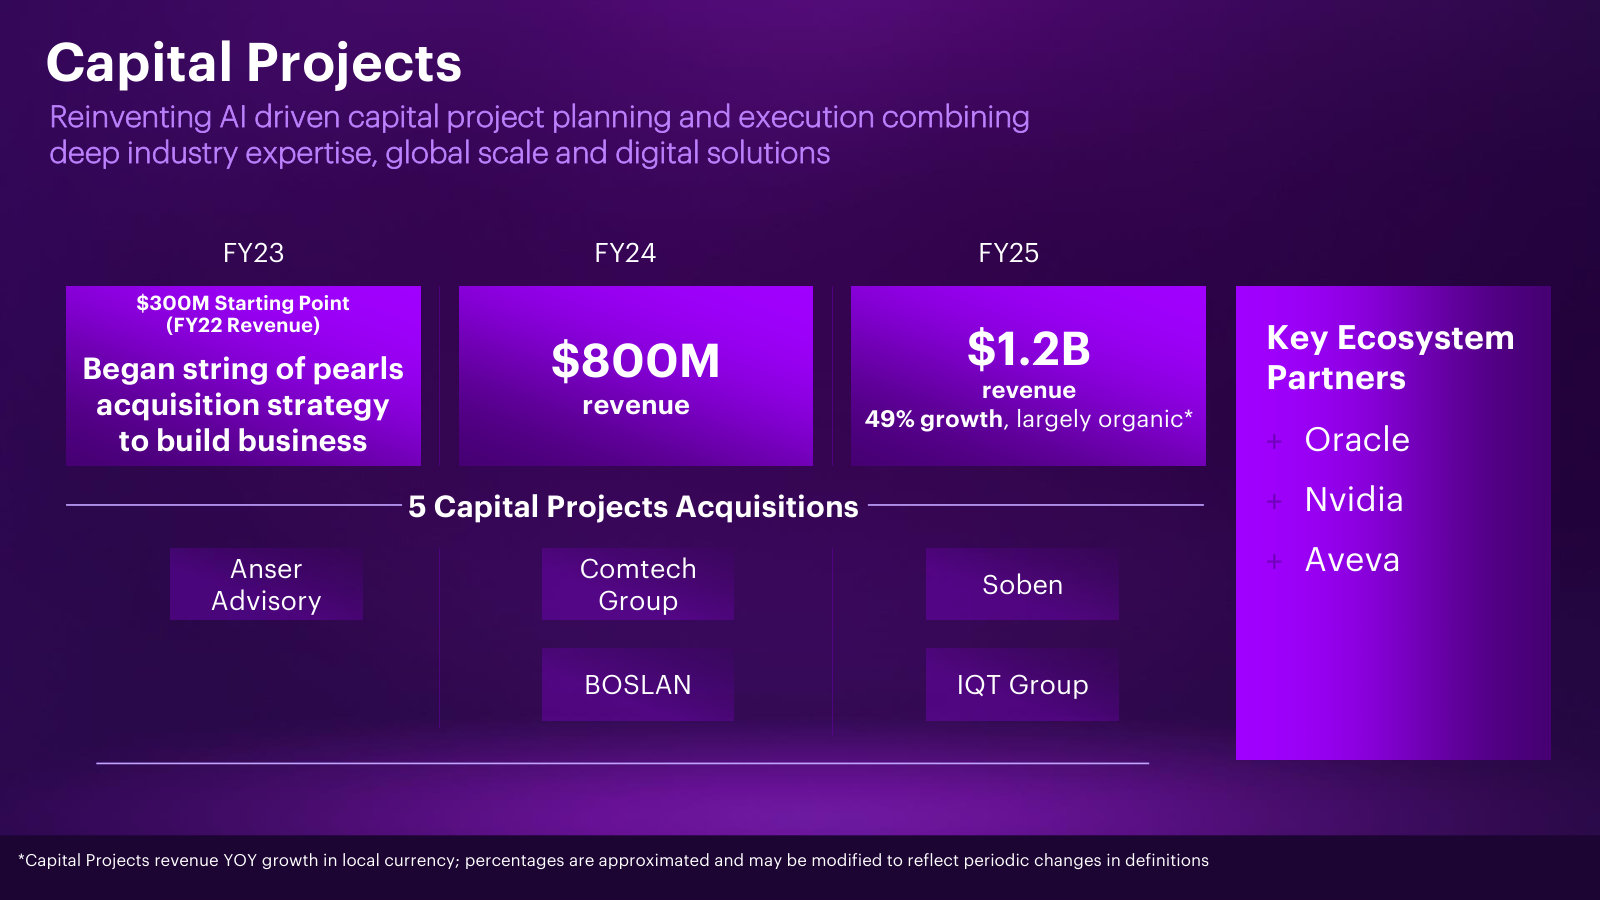
More from management
Q4 and Full-Year FY2024 Earnings Presentation — FY2024 · 13 pages · The FY24 full-year scorecard and the return-metric trend from 32% ROIC down to 26% — the baseline current results sit against. · Open →
Q4 and Full-Year FY2023 Earnings Presentation — FY2023 · 11 pages · FY23 results, the year the $3B AI investment began; ROIC still stood at 27% here, against 21% in the latest quarter. · Open →
Investor & Analyst Conference — Leading in the New — FY2015-FY2016 · 12 pages · Management's pre-AI framing of the same model: durable revenue growth, 10-30 bps of annual margin expansion, disciplined capital return. · Open →
Accenture plc's management answers for the business every quarter. These are the exchanges that explain it best — verbatim, from the call transcripts preserved in Sources. Each link opens the full transcript at that page in a new tab.
Q3 FY2026 Earnings Call — Q3 FY2026
The most recent call, and the one where the pivot toward platform and non-FTE revenue gets its clearest articulation. · Open the full transcript →
Management sizes the quarter's two shortfalls: a $100m Middle East revenue hit and large managed-services deals slipping to FY27.
Julie Sweet (Chair and CEO): I also want to give you context on two factors that impacted our results this quarter. First, we were impacted by the conflict in the Middle East. We saw a revenue impact of approximately $100 million compared to our expectations, which was all consulting type of work – split evenly between the direct impact on our Middle East business and indirect effects outside of the region. In the last few weeks of the quarter, we saw this indirect impact globally in Products, and to a lesser degree, in Resources, mostly in discretionary spend. In addition, Sales in the Middle East were impacted by approximately $400 million and also in EMEA due to longer decision-making. Second, a couple of our large Managed Services opportunities moved into FY27 for company specific reasons.
p. 3 · Read in context →
Cybersecurity compounded from roughly $700m in FY16 to $10bn; the OT platform deal aims to more than triple that addressable market.
Julie Sweet (Chair and CEO): Our expansion into the OT cyber platform business builds on our strong foundation of cybersecurity services, including OT. We have grown our services organically and inorganically over the last decade from roughly $700 million in FY16 to $10 billion in fiscal 2025, a 35% CAGR over the period, 4 times that of Accenture’s over the same period. This investment more than triples our total addressable market in OT Security, which is growing double digit.
p. 5 · Read in context →
The mid-market defined and sized — clients with $300m to $3bn of revenue, a $240bn TAM — and the new business built to serve it.
Julie Sweet (Chair and CEO): We are also expanding our total addressable market by going after a new, exciting customer segment: the mid-market. We estimate that the mid-market, which we look at as companies with between $300 million and $3 billion of revenue, is a $240 billion addressable market for us, growing high single-digits. That is why we are launching a new business next week called Accenture Edge. This business will embed Accenture’s large enterprise expertise and ecosystem relationships in business solutions designed specifically for the mid-market. We see that companies in this segment face many of the same technology, data, AI, cybersecurity and productivity challenges as large enterprises, but they often need solutions that are faster to deploy, more repeatable and right sized for their scale.
p. 5 · Read in context →
The stitching-risk question answered: why OT security, why now, and why three assets become one contract for the client on day one.
Tien-Tsin Huang (JPMorgan); Julie Sweet (Chair and CEO): And then finally, just why prioritize security as an enabler for AI versus other areas to win in AI? We obviously trust what you guys have done in the past. We're just trying to better understand, because this seems more strategic than about adding revenue per se. […] Exactly, this is about long-term growth and really a massive market when you start to think about how it's not even about assets. Everything's going to the physical world, right? Physical AI is coming, everything's going to be connected. And so you can't have an AI revolution unless you have critical infrastructure, and unless you secure when you start moving into physical AI, and you can't have that without OT security. 95% of spend in the past has been about IT security, and OT security is a much bigger market and critical need. And we're starting from a $10 billion cybersecurity services business that we've built over the last 10 years organically and inorganically, a 35% CAGR, and we've been in OT security all along. And so one of the things that we do really well is to understand where the technology is going to create demand in our clients. In terms of the platform itself, Dragos has an excellent platform. The addition of NetRise and runZero is just enhancing an already strong program platform. And what companies today do is they have a bunch of fragments, they have to like contract here and they have to contract here and they have to stitch it together. So day one, just the first thing is it's one contract, right? And then we'll enhance the platform, which Dragos has a ton of experience because they've been building that platform. So we don't see risk at all in terms of stitching it. And day one, we're already making companies a lot happier because they can have one buy, not three.
p. 14 · Read in context →
The four moving parts of the FY27 exit rate, given early: inorganic just under 2%, federal back to growth, deal timing, the conflict.
Angie Park (CFO): Yes. And I think, for us, we did because of the uncertainty that we experienced, particularly in the last three, the last few weeks of the quarter, we did want to make sure that you understood that more of the range is in play. And, Tien-Tsin, I think one of the things that you're trying to get underneath is really around our exit rate and what that looks like going forward, right? So, and I know that that's top of mind for you guys because you use Q4 as that basis, but I want to make sure that I get a few points out for you to consider because this is what we're thinking about as well. So if you think about the acquisitions that we have announced today and the expected closing, we do expect to enter FY27 slightly below 2% of inorganic growth. Secondly is our AFS headwind will sunset this quarter, and we expect that it will return to growth this quarter. The third is related to the managed services opportunities that Julie mentioned and when those actually, when they close in '27. And then, of course, the conflict that Julie already mentioned in discussing with Bryan, that's a variable and we'll see how that evolves. But at the same time, we are executing in new areas, including demand in AI and expanding our TAM.
p. 15 · Read in context →
Why the commercial-model shift runs through M&A: changing how clients buy long-standing services is slow, new categories start non-FTE.
Julie Sweet (Chair and CEO): And Kevin, in terms of just the profile of that revenue, what you're seeing is that we are moving into higher growth areas. So, we're really excited about the cybersecurity acquisitions that we just announced. That's $208 million ARR growing at 53% [sic 48%]. So that's just an example of how we're using the acquisitions to move into higher growth areas. And they have a different profile in terms of their commercial model. So one of the things that I've said consistently is that in things that our clients have been buying in services for a long time, it's going to take a while to like change the buying patterns, which is why we're making, but it's much easier to go into new categories or to provide new kinds of value and switch to non-FTE models. And so you've seen that with what we just did with cybersecurity. You saw that with Ookla. We announced Alphahealth this week in Italy. That's also a services and platform combination. And so we're going to continue to move ourselves into non-FTE, in part by these acquisitions that will then drive organic growth.
p. 17 · Read in context →
Token spend gets the cloud-FinOps treatment — a new optimization practice — and so far no material crowd-out of services budgets.
Jim Schneider (Goldman Sachs); Julie Sweet (Chair and CEO): I was wondering if you'd maybe comment broadly on the client budgetary impact that you're seeing from AI infrastructure spending and token spending specifically in terms of upward pressure on their budgets and what impact are you seeing on sort of what you view as to be your addressable TAM in terms of services and even software and are you seeing any kind of change that would kind of drive some moderation in that infrastructure spending to benefit you in the coming quarters? […] So Jim, one of the things we're clearly seeing, in fact, we have a whole practice that we're starting to grow now is on how to help clients optimize their use of tokens. It feels a lot like the cloud scenarios that we remember when people were moving to the cloud and then they were like, “oh, wait a minute, we're spending a lot more on the cloud than we thought” and we built a whole FinOps practice on helping optimize cloud. So we definitely think that we're seeing that with the clients and they're coming to us because we're doing a really good job ourselves of being able to know how you use the tokens, which models you use for which problems and that's something we've been focused on since the very beginning. It's also helping because we have delivered real ROI and our clients are seeing the spend but they're struggling with the ROI and so it's helping us there. And at the same time, there's a certain amount of spending that's going to happen and so we're not seeing it be material to impact the spend on services today.
p. 18 · Read in context →
Fixed-price work is over 60% and still rising, with no margin difference by type of work — the risk sits inside the guided expansion.
Jamie Friedman (Susquehanna); Angie Park (CFO): And then for my follow-up, last quarter Q2, you had a disclosure about 2025 fixed-price at 60% of work. Can you talk about the evolution of fixed-price? Is that type of work in particular demand and how the margin characteristics of fixedprice may compare to the other dimensions of the company? […] We continue to see our fixed price work be over 60% and continuing to increase. There's no real difference as we look at it by type of work. It's in the similar zone for both consulting as well as managed services. And obviously you see that play out in our margins overall as well. So margins, not a big difference that I would call out relative to fixed-price versus the other commercial constructs, but it is embedded in our 20 basis points of expansion for the year.
p. 23 · Read in context →
Q2 FY2026 Earnings Call — Q2 FY2026
The best single call on why management believes AI is a tailwind, and the toughest questioning of that claim. · Open the full transcript →
The fixed-price disclosure in full: over 60% of work, driven by proprietary platforms and clients buying cost and delivery certainty.
Angie Park (CFO): Within bookings, the percentage of our work which is fixed price continues to increase over 60% in FY25. This reflects the rising importance of our proprietary platforms and clients’ need for cost and delivery certainty—where our scale, experience, and financial strength matter.
p. 6 · Read in context →
The cleanest statement of where Accenture sits in the AI stack: models supply the intelligence, Accenture supplies everything around it.
Julie Sweet (Chair and CEO): We play a critical role in the AI-ecosystem. Foundation models provide the “intelligence”; and our role is helping clients understand what to deploy and when, how to integrate it into their systems, reimagine their processes, modernize their data and digital core, help redesign their operating models and do effective change management, and help build the capabilities and talent needed to scale AI across the enterprise. As the technology changes even more quickly, our clients are turning to us to help them navigate. They also want us to help them go faster—sometimes by building their capabilities and other times by leveraging ours.
p. 8 · Read in context →
The long funnel argued from installed base: hundreds of modern ERP estates were built before advanced AI existed and now have to be redone.
Julie Sweet (Chair and CEO): Let’s look at ERP. We have been the number one partner to all the major ERP ecosystem partners for years, and over the last several years, we deployed modern ERP systems across hundreds of clients. When those systems were implemented, advanced AI did not yet exist. Now those clients want to embed the new AI and data capabilities and transform their end-to-end processes. For example, with one of our largest Oil and Gas clients, we are seeing a clear pattern. First, they modernized their digital core. Over several years, we partnered on a major ERP transformation to implement a cloud-based platform that simplifies operations, standardizes processes, and creates a single source of data across the enterprise. It was a significant, multi-year investment. Now, with that foundation in place, they are investing again—embedding AI directly into the systems that run the business. This is not a separate layer of technology: it is intelligence built into core workflows— across finance, supply chain, asset maintenance, and field operations. These capabilities analyze large volumes of data, initiate routine actions, and support better decisions in real time. The impact is tangible: faster cycle times, fewer manual steps, lower operating costs, and stronger operational resilience. We are beginning to see this same sequence more broadly—modernization of the core, followed by AI-driven enhancement. Enterprise systems are becoming the platform that allows AI to deliver value at scale.
p. 9 · Read in context →
Asked for hard evidence that Accenture is a net AI winner, management concedes there is no clean metric and names what it does watch.
Jason Kupferberg (Wells Fargo); Julie Sweet (Chair and CEO): What kind of quantitative evidence should investors be looking at to help substantiate the view that Accenture is a net beneficiary of AI. […] Thanks, Jason. I would just start with that at this point in our business, AI is permeating everything we do because it either is driving why clients are actually doing things like moving to the cloud. But when we're doing something that isn't specific AI, they're looking at our AI credentials because everything is aimed to get to AI. And then of course, we have direct AI and then our managed services business is being evaluated by how good our platforms are and their expectations of building AI. And so like to start with, like your first kind of way of looking at is, how is our business performing relative to everyone else and are we taking market share, right? That is the – because at this point, it's not isolated, right? It really is why we're winning and it's – you have to have it to win – you have to be leader to win at the levels we're winning of like $22 billion. And then we're going to give you metrics, Jason, over time that will change to kind of tell you. And so today, we look at market share, we look at our overall growth. And then the metrics we're giving you are the ones we're using, which is because everything is so tied to the big ecosystem, is our growth with that ecosystem outpacing overall growth? And then how are we doing with the emerging players? And then we are looking at how many companies are initiating AI with us among our client base, which are the metrics we gave you today. So the metrics will change, right, but they'll reflect what we're looking at as we drive our business.
p. 14 · Read in context →
Why a better frontier model does not translate into bookings: the model is the engine, the wheels and transmission are the work.
Tien-Tsin Huang (JPMorgan); Julie Sweet (Chair and CEO): Julie, appreciate your comments there on why it's a tailwind. But I was just thinking with these frontier models that are improving so quickly, it's driving a lot of news flow and a lot of debate. And are you seeing any correlation? Are you tracking this how these models and how they're improving and their capabilities improving and how that might impact your bookings growth and conversion to revenue? I'm just trying to understand if there's some kind of correlation or pattern and how that might impact your numbers here going forward as the frontier models improve. […] It's a great question and I think it goes to the heart of kind of what's diferent with models versus when you release functionality in a packaged solution as we've seen in the past, right, is the models are basically just a super powerful engine. So if you think about the car, right, you've got this great engine, only if it's connected to everything, if it has wheels, so you can actually make it run and the transmission to guard it. And so, when the models come out, there isn't a direct correlation to bookings or new work. But what it does is create the next opportunity for us to look at what are the solutions that it's going to now create. And so if you think about in earlier days, a lot of the work was focused on things like summarization and content creation, the better the models are, it's able to fuel things like moving into agentic – where you – and we're starting to see that. So we're starting to see more experimentation and use of agents really basic workflows as the models get better. So think of the release of the models as the beginning of creating new opportunities for us to take to our clients, even as a lot of work that we're doing based on everything that has already happened.
p. 15 · Read in context →
The honest split on AI demand: 78% of the C-suite now says growth matters most, but efficiency use cases are still what gets bought.
Julie Sweet (Chair and CEO): But with respect to AI, how would you characterize the mix of advanced AI work between growth or revenuegenerating use cases against the eficiency-led use cases? We hear a little bit of a pickup on the growth side, but love to hear what you're seeing on-the-ground there on the mix shift. […] So I think the first shift that's happening is the focus. It is not yet in the mix. So, our latest survey that we do every quarter of the C-suite and how their view of AI, the latest survey had 78% now saying we think growth is going to be the biggest value. That's not yet translating on-the-ground to being the biggest driver, mostly because of where the technology is. If you think about kind of the early days, a lot of it is about content, summarization, et cetera, that is really an eficiency play. And as the capabilities improve, you start to see more ability to take it into the core business and to do more complex work. So we are absolutely seeing an uptick in growth –growth-focused AI programs, but eficiency is still leading the way. I will tell you that the most exciting area right now on growth is conversational and agentic commerce. Demand is surging there. And I think as that – and that's where we're investing a lot, I think as that takes of, you're going to start to see real results from on the growth side from these new developments and that's a whole new market and it's a whole new opportunity for us that we're super well positioned, of course, because of Song.
p. 16 · Read in context →
The capital-allocation doctrine: buy into higher-growth adjacencies to fuel organic growth, now with data and IP that break the FTE link.
Jonathan Lee (Guggenheim Partners); Julie Sweet (Chair and CEO): Can you help us understand what's driving the step-up in deployment and whether this reflects a shift in acquisition strategy toward larger or earlier-stage assets, higher multiples in the market or perhaps a pivot toward IP-led deals? […] So, our strategy that we've executed over the last decade or so has been to use V&A often to go into new areas that are higher growth. So, we did that with Accenture Song. We've done that with Industry X, you saw us do that with capital projects over the last few years. And that is all to fuel organic growth, right? So, it's increasing our total addressable market by going into new higher growth areas. And that's again what you're seeing us do that. And we're doing that in key AI enablers. And so those are things like data centers, energy infrastructure. We're doing that in big secular trends like defense. You've seen those acquisitions over the last couple of years and public sector is another one. Education is another one. So, higher growth areas, increasing our TAM. And then increasingly, we see an opportunity to meet unmet demand in the market where you don't have solutions where we can build products either organically or by purchasing them. So, our Faculty acquisition, for example, has a really unique decision intelligence product. And then in addition, there are new commercial models where data is one of the key enablers of AI. And so you saw our Ookla acquisition, which is really about an incredible data set. And the way that then gets into our business is in the network is really core to both communications and all enterprises and to use AI, having this kind of a dataset is incredibly powerful and it's a completely diferent commercial model, a licensing and subscription base.
p. 20 · Read in context →
What the pivot costs: higher multiples and a smaller immediate earnings uplift, accepted for higher growth and margin later.
Angie Park (CFO): Yeah. And so, in some cases, we are paying higher multiples than in the past. So the immediate uplift is lower in those instances than prior acquisitions. So that said, we are intentionally shifting towards higher growth, higher margin assets that are going to fuel organic growth and strengthen our capabilities, and it's really to position us for long-term growth and returns.
p. 21 · Read in context →
The compression question head-on: if AI collapses an ERP migration to two weeks, why is that not a smaller TAM for integration work?
Jonathan Lee (Guggenheim Partners); Julie Sweet (Chair and CEO): As a follow-up, one of your partners recently highlighted the ability to reduce SAP ERP migration workloads to as little as two weeks using AI, how do you respond to concerns that AI tools are compressing project timelines, relative rate cards, and reducing the TAM for systems integration work? And are you seeing similar compression in your own engagements? And if so, how are you ofsetting this through volume or new service oferings? […] So, in general, you should think about our strategy is always that the more that we can use technology to bring more value to clients faster, the better it is for our business. And that's the strategy you've seen us execute ever since RPA really burst on the scene in 2015, because when you can actually make, especially the technical piece of it go faster, there's so much work, all the process change, all the change management, et cetera, that like the SAP deals are multi-year and those often become gating items that they're not investing in other parts of the technology landscape or other parts of the business because they are these huge projects. And so, we see this as whether it's in ERP or mainframe, it helps, because the actual technical piece is a small piece compared to the rest of the work and it leads to more work. And so, for example, just last week, we were at AIPCon Palantir's conference with SAP, Palantir and Accenture on stage saying we're going to develop those products. They're really not developed yet at scale in any way. But we're working together because it will be a net benefit to our clients, which means it will be a net benefit to us. That's how we think about it.
p. 21 · Read in context →
Q4 and Full Year FY2025 Earnings Call — Q4 FY2025
The annual call: FY25 in full, the guidance convention, the talent rotation and the reorganization into Reinvention Services. · Open the full transcript →
What the AI figures do and do not include — the disclosure boundary behind $2.7bn of revenue and $5.9bn of bookings in FY25.
Julie Sweet (Chair and CEO): Our early and decisive decision in FY23 to invest significantly to become the leader in Gen AI with a $3 billion multi-year investment is clearly paying-of as we capture this new area of spend for our clients. In FY25, we tripled our revenue over FY24 from Gen AI and increasingly agentic AI to $2.7 billion. And we nearly doubled our Gen AI bookings to $5.9 billion. And as a reminder, these numbers only reflect revenue and bookings specifically related to advanced AI, which is Gen AI, agentic AI and physical AI and do not include data, classical AI or AI used in delivery of our services. We're now going to use the term advanced AI as it encompasses the latest developments that are starting to gain traction.
p. 3 · Read in context →
The talent rotation stated plainly — upskill first, exit fast where reskilling will not work — alongside the single-unit growth model.
Julie Sweet (Chair and CEO): In addition to continuing to hire world-class talent, in FY25, we developed and are implementing a refreshed robust three-pronged talent strategy to rotate our workforce. We are investing in upskilling our reinventors, which is our primary strategy. We are exiting on a compressed timeline, people where reskilling, based on our experience, is not a viable path for the skills we need. And, we're continuously identifying areas of how we operate Accenture to drive more eficiencies, including through AI in order to create more investment capacity. […] Finally, our growth model. On September 1, we launched reinvention services, which brings all of Accenture's capabilities into a single unit. Nearly 80% of our large deals are multi-service. The model as we fully roll it out will make it faster and simpler to sell and deliver everything Accenture ofers and to rotate our oferings to embed more AI and data and equip our people.
p. 4 · Read in context →
The roughly $865m charge decomposed: compressed severance for the talent rotation plus divestiture of two off-strategy acquisitions.
Angie Park (CFO): Before I move on to the details of the quarter, I want to spend a moment on the six- month business optimization program we initiated in Q4, for which we recorded a charge of $615 million and expect to record an additional approximately $250 million in Q1, for a total of approximately $865 million over the period. The business optimization program has two parts. One related to rapid talent rotation that Julie mentioned, which reflects severance associated with headcount reductions that we are making in a compressed timeline, and second, related to the divestiture of two acquisitions that are no longer aligned with our strategic priorities. These actions will result in cost-savings, which will be reinvested in our people and our business.
p. 5 · Read in context →
Why enterprise adoption lags the mindshare — and why management treats that gap as its demand pool rather than a threat.
Julie Sweet (Chair and CEO): It is well recognized that advanced AI has taken the mindshare of CEOs, the C-suite and boards faster than any technology development we've seen in the past two decades. At the same time, as reported widely, value realization has been underwhelming for many and enterprise adoption at scale is slow other than with digital natives. This is why our clients are turning to us. We know that the gap between mind share and faster actual adoption is because the enterprise reinvention required to truly unlock the value of advanced AI is hard and has significant costs. There is a huge diference between how we're all using AI in our individual lives that is incredibly easy and what it takes to use it in an enterprise. The opportunity for AI is at the intersection of business strategy and tech and org readiness. For most companies, the biggest gap between mind share and adoption is tech and org readiness. We're still in the thick of cloud, ERP and security modernization. Data preparedness is nascent and many companies grapple with fragmented processes and siloed organizations. Generations of leaders need new skills to understand how AI should inform their business strategy. The workforce needs new skills to use AI and new talent strategies and related competencies must be developed.
p. 9 · Read in context →
The guidance convention that recurs every quarter: the top of the range assumes no change in discretionary spend, the bottom allows decay.
Tien-Tsin Huang (JPMorgan); Angie Park (CFO): I wanted to – my first question I'll ask on visibility on revenue growth, if that's okay. Just love to hear your thoughts on visibility compared to the last couple of years given the backlog, which is quite big with large deals, you have the pipeline, of course, and then what you're seeing on discretionary spending given the economic backdrop as you see it? […] As we look at FY26, we feel really good about our positioning. And so as you said, you saw our strong bookings of $80.6 billion in FY25 that positions us for FY26. We can see our backlog from the large deals. And if you look at our pipeline and looking at our pipeline, it's solid overall and we see strong demand for our large transformation deals. From a discretionary perspective, what we've assumed is at the top-end of the range, there's no change in discretionary spend, while at the bottom of the range, it allows for deterioration. And by the way, as you think about our guidance of 2% to 5% excluding AFS, we're at 3% to 6% for the year.
p. 13 · Read in context →
The core bull case in management's own words: client AI savings are not lost, they fund the next item on an effectively unlimited list.
Tien-Tsin Huang (JPMorgan); Julie Sweet (Chair and CEO): Just give us your latest thoughts on AI driven productivity and those gains and how they might unfold. I get that question quite a bit from investors. Do you see potential deflationary efects and how might that impact Accenture services both positively and negatively? […] Great. Thanks, Tien-Tsin. So we don't see AI as deflationary. We do see and are seeing it as expansionary similar to every tech evolution we've been through. The move from an analog to digital, from on-prem to cloud and SaaS, and is many of you who have been with us over the course of the years have known, in every successive tech evolution, we've become stronger. And so if you look at AI, we see the same thing. Yes, AI absolutely boosts eficiency in areas like coding or operations, but those savings don't disappear. They're being reinvested into new priorities. The list of what our clients want to do with technology is truly virtually unlimited. And so when we can save them money by delivering our services with advanced AI, that frees up their budget to do the next things on their list and that's what they're doing. They're always going to those next priorities and we're best-positioned then to help them. That is how we delivered our 7% growth last year. I mean, two years in, we're seeing the pattern for how that journey to advanced AI is expanding our business. And by the way, I will add that one of the most consistent things that I'm telling CEOs today is that their AI strategy has to focus on both growth and productivity. And almost every CEO that I've talked to says they pivoted way too far toward productivity and not enough to growth, which of course, we are helping them with, with things like Song. And we give that advice really from our own experience in how we have successfully grown through every tech evolution, embracing the productivity on one-side and then capturing the opportunity it creates on the other side by helping our clients.
p. 14 · Read in context →
A disclosure question answered candidly: data is kept out of the advanced-AI figure so the new-spend number stays clean.
Jamie Friedman (Susquehanna); Julie Sweet (Chair and CEO): I wanted to ask, Julie, about the way you're defining advanced AI. And I think if the transcript is right, you say Gen AI, agentic AI and physical AI. I'm actually asking about why you're saying you won't – you're not including data because we've sort of been trained that data is foundational. So why is the data component not in the definition of advanced AI? […] Because what we're trying to help share with you is how we're taking spend in a new market. And by the way, data is absolutely critical. In fact, one out of every two projects in Gen AI, agentic AI, physical AI now has significant data pull-through. So our data business is on fire, right? Like this is an absolutely critical area. Companies are just getting started. It's nascent in many places. It's part of the digital core that we're building. It's just that to date, we've wanted to share with all of you transparently the really new areas.
p. 17 · Read in context →
Where the savings go: over $1bn from the optimization program is reinvested, leaving only modest margin expansion on the table.
Bryan Bergin (TD Cowen); Angie Park (CFO): Can you talk about, maybe assumed savings you expect to achieve from this optimization plan and how it may help you evolve your operations? I'm specifically curious if you see that kind of combined with Gen AI adoption internally, allowing you to operate at a sustainably higher utilization as that did tick-up this quarter. […] I think that for overall, we expect savings of over $1 billion from our business optimization program, which we expect that we will reinvest in our business and in our people because it's so important for our future growth. And so we expect to reinvest that while still delivering modest margin expansion.
p. 19 · Read in context →
Q2 FY2025 Earnings Call — Q2 FY2025
The shock call: the GSA federal contract review disclosed live, and the thesis tested on how much revenue was really at risk. · Open the full transcript →
The disclosure that reset the stock: GSA told agencies to review contracts with the top 10 consultancies and terminate the non-critical.
Julie Sweet (Chair and CEO): First, Accenture Federal Services. Federal represented approximately 8% of our global revenue and 16% of our Americas revenue in FY ‘24. As you know, the new administration has a clear goal to run the Federal government more efficiently. During this process, many new procurement actions have slowed, which is negatively impacting our sales and revenue. In addition, recently, the General Service Administration has instructed all federal agencies to review their contracts with the top 10 highest paid consulting firms contracting with the U.S. government, which includes Accenture Federal Services. The GSA's guidance was to terminate contracts that are not deemed mission critical by the relevant federal agencies. While we continue to believe our work for federal clients is mission critical, we anticipate ongoing uncertainty as the government's priorities evolve and these assessments unfold. Based on our significant experience across federal and commercial clients, we see major opportunities over time for us to help consolidate, modernize, and reinvent the federal government to drive a whole new level of efficiency.
p. 3 · Read in context →
How management framed the March 2025 shift: uncertainty sharply elevated since December, industry fundamentals asserted to be unchanged.
Julie Sweet (Chair and CEO): Second, in recent weeks, we are seeing an elevated level of what was already significant uncertainty in the global economic and geopolitical environment, marking a shift from our first quarter FY ‘25 earnings report in December. At the same time, we believe the fundamentals of our industry remain strong and we are very well positioned with our clients because all strategies continue to lead to reinvention through new ways of working, tech, data, and AI. We are confident in executing our strategy to help clients reinvest. As you would expect, we are laser focused on bringing tremendous value to our clients. Our strengths lie in our agility as the market we operate in changes, utilizing our deep client and ecosystem relationships and our leading position in Gen AI and technology more broadly. We are also well diversified across markets, industries, and types of work, which enables us to continue to lead in a changing market context as we have done before.
p. 4 · Read in context →
Pressed to quantify federal exposure, management declines to split it: 8% of the business, the range is the disclosure.
Tien-Tsin Huang (JPMorgan); Julie Sweet (Chair and CEO): Is there – maybe to ask it differently, just is there a way to frame the real revenue at risk? I know mission-critical is, maybe hard to define it here on the call, but is there anything that you can share in terms of what's really at risk or not at risk thinking about duration or is it really more of an issue of replenishing work, etc.? Just trying to get a better understanding of visibility there. […] Sure. And so, Tien-Tsin, what I would say is, and what we've been clear about is the guided range we're giving for the quarter and for the year reflects our best view of the impact that's coming from both the slowing of new procurement actions and the assessments of the work that we're doing, and so we don't get into different pieces of it, but – those two things, the range of outcomes and that's reflected in the range. I mean, it is 8% of our business. We have lots of other parts of our business that are about that size that we are always looking at estimates and assumptions. And so this is our best view of it today and the range reflects it.
p. 13 · Read in context →
A precise correction of the premise: uncertainty rose in recent weeks, but management says no slowdown had shown up in the business.
James Faucette (Morgan Stanley); Julie Sweet (Chair and CEO): As we talk about the little bit of the slowdown that you've seen in recent weeks, how would you characterize it geographically or industry vertical? Just trying to get a little more color there. And what do you think those customers are looking for in terms of their, proceed or continue to pause or hesitate, type of decision making? […] Thanks, James. I want to be clear, we haven't seen a slowdown in the last few weeks. What we commented on, which I think is kind of everyone is well aware of is in the last few weeks, there's been an elevated level of what was already significant uncertainty and there's a couple of big themes around that, obviously tariffs, and that's a global discussion. That is not just an Americas discussion. And also consumer sentiment, which is a little bit more of an Americas discussion. And so we're really just commenting on what I think we're all seeing and that's only been in the last few weeks, and so we're already, of course, in the heart of the discussions of clients globally who are talking about it.
p. 16 · Read in context →
Do clients claw back the AI savings? Managed-services contracts already assume technology-driven productivity, so the model is unchanged.
Keith Bachman (BMO Capital Markets); Julie Sweet (Chair and CEO): But are you seeing any changes in the nature of your economic relationship with your customers? In other words, are customers asking for some of the savings or is there any change in that narrative on how the supply side and economic relationship broadly speaking with your customers may unfold as Gen AI matures a little bit? […] So I think in the first question, what we've been seeing with Gen AI is what we've seen in the past when we have new technologies, like, I take you back to 2015 when we first announced MyWizard, which we now call GenWizard, as we've introduced Gen AI and that was that major shift that occurred with respect to automation, which by the way is still relevant, right? And so that – we are not seeing a different change. We've been continuously – remember like, particularly, on the managed services side, our contracts assume that there's going to be more efficiency driven from technology. Gen AI is allowing that to kind of go up over time. But like the way that the model is working is just very similar to what we've seen with prior waves of big efficiencies from technology. So we're not seeing new patterns evolve there.
p. 18 · Read in context →
What management says holds the business together through shocks: decade-long client relationships, diversification and ecosystem position.
Julie Sweet (Chair and CEO): And then again, what I would say on the – how things might layer in. CEOs are actually focused on: how do I succeed regardless of the level of uncertainty? So the conversations we're having are not, hey, what happens if the tariffs that – this gets resolved, etc., it's okay. We have a higher level of uncertainty than we did 90 days ago, and so how do we then reinvent faster, right? What do we need to shift to? CEOs, and this is not from – this has been going on for now for a few years, right? They're embracing that their responsibility is to grow regardless of what has been, in my tenure as CEO, in the last six years, a series of a lot of different events. And that's why as we think about our own business, right, we continue to anchor on the characteristics that have allowed us to be the leader over these different cycles, that's the deep client relationships. Our top 100 clients we've been with for over 10 years, the diversification of geographies, industries, I do want to give a shout out to all my industry teams. The industry groups all – we had broad based growth, but it allows us for that diversification as well as types of work and then the all-important ecosystem relationships and our leadership in Gen AI and technology. Those are the building blocks of our resilient business and we all, our CEOs and ourselves have to be agile to succeed in whatever market and that is what our range reflects. The fact that we took the bottom off of the range reflects our belief in our resilient model as we continue to navigate.
p. 21 · Read in context →
Q3 FY2023 Earnings Call — Q3 FY2023
The origin of the AI strategy: the $3bn investment explained, with a candid read on cost, ROI and how long it would take. · Open the full transcript →
The commitment that set the next three years in motion: $3bn into AI and a doubling of the data and AI workforce to 80,000.
Julie Sweet (Chair and CEO): Our approach to AI is clear. Just as we have successfully done with cloud, we are investing to take an early lead, and position for the opportunity ahead. Last week, we announced a $3 billion investment in AI, a big step to accelerate our clients' reinvention journey, which includes us doubling our data and AI workforce from 40,000 to 80,000 strong, including the expansion of our center for advanced AI that today has over 1,600 generative AI experts bringing new assets such as our AI Navigator for Enterprise to life, and developing new GenAI-powered industry solutions. And across this all, we are leading with responsible AI to be the most trusted source in helping our clients mitigate the risks as they drive value.
p. 8 · Read in context →
The bifurcation that has shaped demand ever since: small discretionary projects falling away while large transformations hold up.
Lisa Ellis (MoffettNathanson); Julie Sweet (Chair and CEO): Let's dive in on the Strategy & Consulting. I know it was a high single-digit decline this quarter. That – just looking back at your comments from last quarter, I think that came in a little bit softer than you expected. But then you also called out many new projects coming in related to GenAI and other technologies. Can you just talk a little bit about kind of what's changed, what that evolution looks like and kind of what's your confidence level in the time horizon that we'll see Strategy & Consulting improve over the next couple of quarters? […] So the big difference in our expectations from last quarter and where we ended up, really was all in the small deals. And we saw further – they came in lower than we expected, and we saw that extend to Europe and the Growth Markets. Now that was both in S&C and systems integration. But that's the big reason that we have a difference in sort of where we thought where we would be this quarter. Now, our job is to continue to pivot to higher – where there is higher-growth, and we're working on that in digital manufacturing, supply chain, data and AI. But that will take a little time. And what we're seeing is that there's a lot of extensions going on in small deals, but it's the newer, small projects, while at the same time, we continue to have very strong bookings and interest and huge opportunity in transformations.
p. 9 · Read in context →
The clearest statement of the managed-services model anywhere in the set: at least 10% productivity every year, and how it gets found.
Lisa Ellis (MoffettNathanson); Julie Sweet (Chair and CEO): But can you give your view on how you see GenAI impacting the IT services industry overall? Like, a lot of people make an analogy to sort of the impact of offshoring on the industry and sort of other big sort of step function changes to the operations and the kind of composition and the way IT services is done. Can you kind of give your latest perspective on that, how you see it affecting Accenture and your industry more broadly? […] So think about it first in context of Managed Services. Every year, right, we have to find at least 10% of productivity. So we talk a lot about our platform, things like myWizard and that. That's all AI-enabled. Just year-to-date in operations, not using GenAI, right, we have automated 13,000 jobs and then we've reskilled those people and redeployed them. Our business model requires us to get at least 10% productivity year in and year out. As we're getting to the maturity of automation and AI before generative AI, we see generative AI as our ability to continue to give at least that 10% productivity year in and year out. So in the Managed Services area, we see that more as the ability to continue doing what we have to do as kind of the next generation of technology. Where we're super excited is in software development that is more around our systems integration and our big transformations around platforms because while we do automate there, we think GenAI may provide a real opportunity to do even more. And remember, our strategy is to deliver compressed transformations. So the more that we can find ways to deliver faster and less costly, that's going to be a big differentiator. So we're leaning in hard.
p. 11 · Read in context →
Unusual candor at the peak of the hype: GenAI is expensive, the ROI is unproven, and the $3bn is a bet on being early anyway.
Julie Sweet (Chair and CEO): At the same time, these technologies are really early. And so for example, we're doing a lot of experimentation now. It's really good for things like documentation, but complex integrations, being able to use them for highly architectured systems, which is what our large enterprises do – GenAI isn't there yet, right? So we think it's going to take some time. We also don't yet know the cost. And one of the things we are really – a lot of clients are looking at us for is to help them with the business case because most of the studies, including our own, are all about what’s potentially [the] uses of it. But because these products aren't out yet, we know that – it's much more expensive to use GenAI, it's much more energy [intensive] [corrected]. And so the actual ROI – so there's the art of the possible, but what's actually the return – it's still really early days. So we're very excited that we can get new kinds of productivity, particularly on things like consulting and systems integration but it's early days yet. And we are leaning in because we think it's a big opportunity for us to differentiate. And that's why we are investing $3 billion over the next three years because we think this is like another Cloud First moment where we were out early, we invested at scale.
p. 11 · Read in context →
Asked to underwrite the $3bn against the Cloud First precedent, management declines to quantify — a record of what was not promised.
Tien-Tsin Huang (JPMorgan); Julie Sweet (Chair and CEO): So on the AI front, you did mention, I think, the Cloud First. Do you draw that parallel when you guys – I think that was three years ago, you did a $3 billion Cloud First investment. That's paid off very well for you. So I'm curious, do you expect a similar return here on the $3 billion you're putting into AI? How should we measure that? Or is it going to perhaps convert differently in terms of the returns? […] Tien-Tsin, that's a great, clever way to try to get us to talk about more of the future. But what I would say is we've got a great track record of investing and getting a great return. And so we think that it's going to pay off well.
p. 14 · Read in context →
Where the money was expected to come from: not pure GenAI but the data and digital-core work that has to happen before it.
Bryan Keane (Deutsche Bank); Julie Sweet (Chair and CEO): I get that it's early, but the big question everybody is asking is how long will it take before it moves the needle in bookings and revenue. Is that a couple of years out still? Or is that the time frame and the rapidness of the use of the technology should push it earlier than a normal technology wave? […] Well, Bryan, I think in general, we think GenAI is going to go faster than, say, cloud, right, which took more like a decade. I would focus on – so first of all, we're being very rigorous when we talk about GenAI because we're really saying like what are the actual GenAI. The big growth, we think, is going to be in all the companies that then have to get their data done faster. And we're not lumping that together. And so I don't know what others are going to do, but we're really being very pure in saying like, "Hey, this is pure GenAI." And if you think about where companies are, our research shows like only 5% to 10% of companies are mature right now with data and AI, and they're the ones that are really going to be able to use GenAI at scale. We just had this research done that came in last week that hasn't been published yet. About 50% of companies have not started on their data or AI journey, and everything in between – some are good in data but not AI. They're having a hard time to scale. So where we think growth is going to come particularly next year, the bigger growth is going to be not in like the pure GenAI, but it's going to be in helping companies finish getting their end-of-life data migrated to the cloud. Because you need your data in the cloud, right? It's going to come in the data strategy and the – all the governance and getting it architected while some of the stuff around GenAI gets sorted out. So for example, cost is not there yet. And how do you take data from one cloud and there's cost to take it and put it another cloud. All of that, we're going to be working with our clients and our technology partners – to really create the right business cases. But the growth we think in the near term is going to be from accelerating the digital core. And that's why we feel really good about the bigger transformational deals continuing next year because there's so much work to do.
p. 16 · Read in context →
More calls
Q1 FY2026 Earnings Call — Q1 FY2026 · 23 pages · Go here for the data-center services thesis: the DLB Associates majority stake and the roughly $12bn addressable market management expects to double by 2030. · Open →
Q3 FY2025 Earnings Call — Q3 FY2025 · 21 pages · The call that announced Reinvention Services, folding Strategy, Consulting, Song, Technology and Operations into one unit from September 1, 2025. · Open →
Q4 and Full Year FY2024 Earnings Call — Q4 FY2024 · 22 pages · The trough year in management's own words: 2% local-currency growth on $81bn of bookings, the completed cost programme, and the CFO handover to Angie Park. · Open →
Q2 FY2024 Earnings Call — Q2 FY2024 · 23 pages · The sharpest description of the discretionary squeeze — “another turn of the dial on constraining spending” — and how it changed the shape of bookings. · Open →
Q4 and Full Year FY2023 Earnings Call — Q4 FY2023 · 24 pages · Useful for the runway sizing management uses (share of workloads still off the cloud) and for how badly the CMT industry group dragged on FY23. · Open →
Q4 and Full Year FY2021 Earnings Call — Q4 FY2021 · 19 pages · The Cloud First precedent that every AI answer is measured against: a dedicated unit taking the cloud business from $12bn to $18bn in a year. · Open →
Accenture plc's annual reports contain management's most considered account of the business. These are the sections, passages and visual pages worth opening in the originals preserved in Sources.
Accenture plc — FY2025 Annual Report (Form 10-K) — FY2025
First report on the new operating model: services folded into one Reinvention Services unit, segments recut into three markets. · Open the full document →
To our Shareholders — p. 3 · Read the full section →
Management's own read of the year: a market it calls persistently challenging, and the advantages it says it leaned on.
Julie Sweet on the fiscal 2025 market and the advantages the company says it built on.
In fiscal year 2025, Accenture delivered strong financial results and significantly elevated our competitive positioning, taking our next big steps to position us for growth in the age of AI. We built on the rapid shift we made in our business by the end of fiscal year 2024 to address challenging market conditions, which continue to persist. We then took action to fully capitalize on the competitive advantages we have built over a long period of time. […] These advantages include our ecosystem partnerships; our breadth of capabilities; our deep and trusted client relationships—we have partnered with 195 of our top 200 clients for 10 or more years; our track record of investing in new skills and rotating our business with successive technology revolutions; and our ability to invest. We know our clients and their industries inside and out, and, with these competitive advantages, we believe we can serve more of their needs for large-scale transformations than any other player in the industry.
p. 3 · Read in context →
Item 1. Business — Overview — p. 22 · Read the full section →
The business description in management's words: what Accenture sells, to whom, and the three axes it manages by.
How the company defines itself, its markets and its two types of work.
Accenture is a leading solutions and global professional services company that helps the world’s leading enterprises reinvent by building their digital core and unleashing the power of AI to create value at speed across the enterprise, bringing together the talent of our approximately 779,000 people, our proprietary assets and platforms, and deep ecosystem relationships. Our strategy is to be the reinvention partner of choice for our clients and to be the most AI-enabled, client-focused, great place to work in the world. […] We serve clients and manage our business through three geographic markets: Americas, EMEA (Europe, Middle East and Africa) and Asia Pacific. These markets bring together all of our Reinvention Services with both local and global talent and solutions. We go to market by industry, leveraging our deep expertise across our five industry groups— Communications, Media & Technology, Financial Services, Health & Public Service, Products and Resources. We deliver two types of work: Consulting and Managed Services.
p. 22 · Read in context →
Reinvention Services — p. 23 · Read the full section →
The structural change of the year — five separately described services collapsed into one business unit from September 1, 2025.
The September 1, 2025 consolidation of all services into a single integrated unit.
Effective September 1, 2025, we brought all of our services, which are described below, together into a single, integrated business unit called Reinvention Services. With this change, our client-focused growth model is bringing together all our capabilities across strategy, consulting, technology, operations, Song and Industry X, […] plus our technology ecosystem partnerships, to create more leading solutions faster and embed AI and data more easily into creating and delivering our solutions and services. […] With the majority of our large deals today already involving capabilities across multiple areas, the full rollout of our model is designed to make it faster and simpler to sell and deliver everything Accenture offers across our client base, while embedding more AI and data and equipping our people.
p. 23 · Read in context →
Industry Groups — p. 24 · Read the full section →
Where the revenue actually sits: five industry groups, their fiscal 2025 revenue and the sub-industry mix inside each.
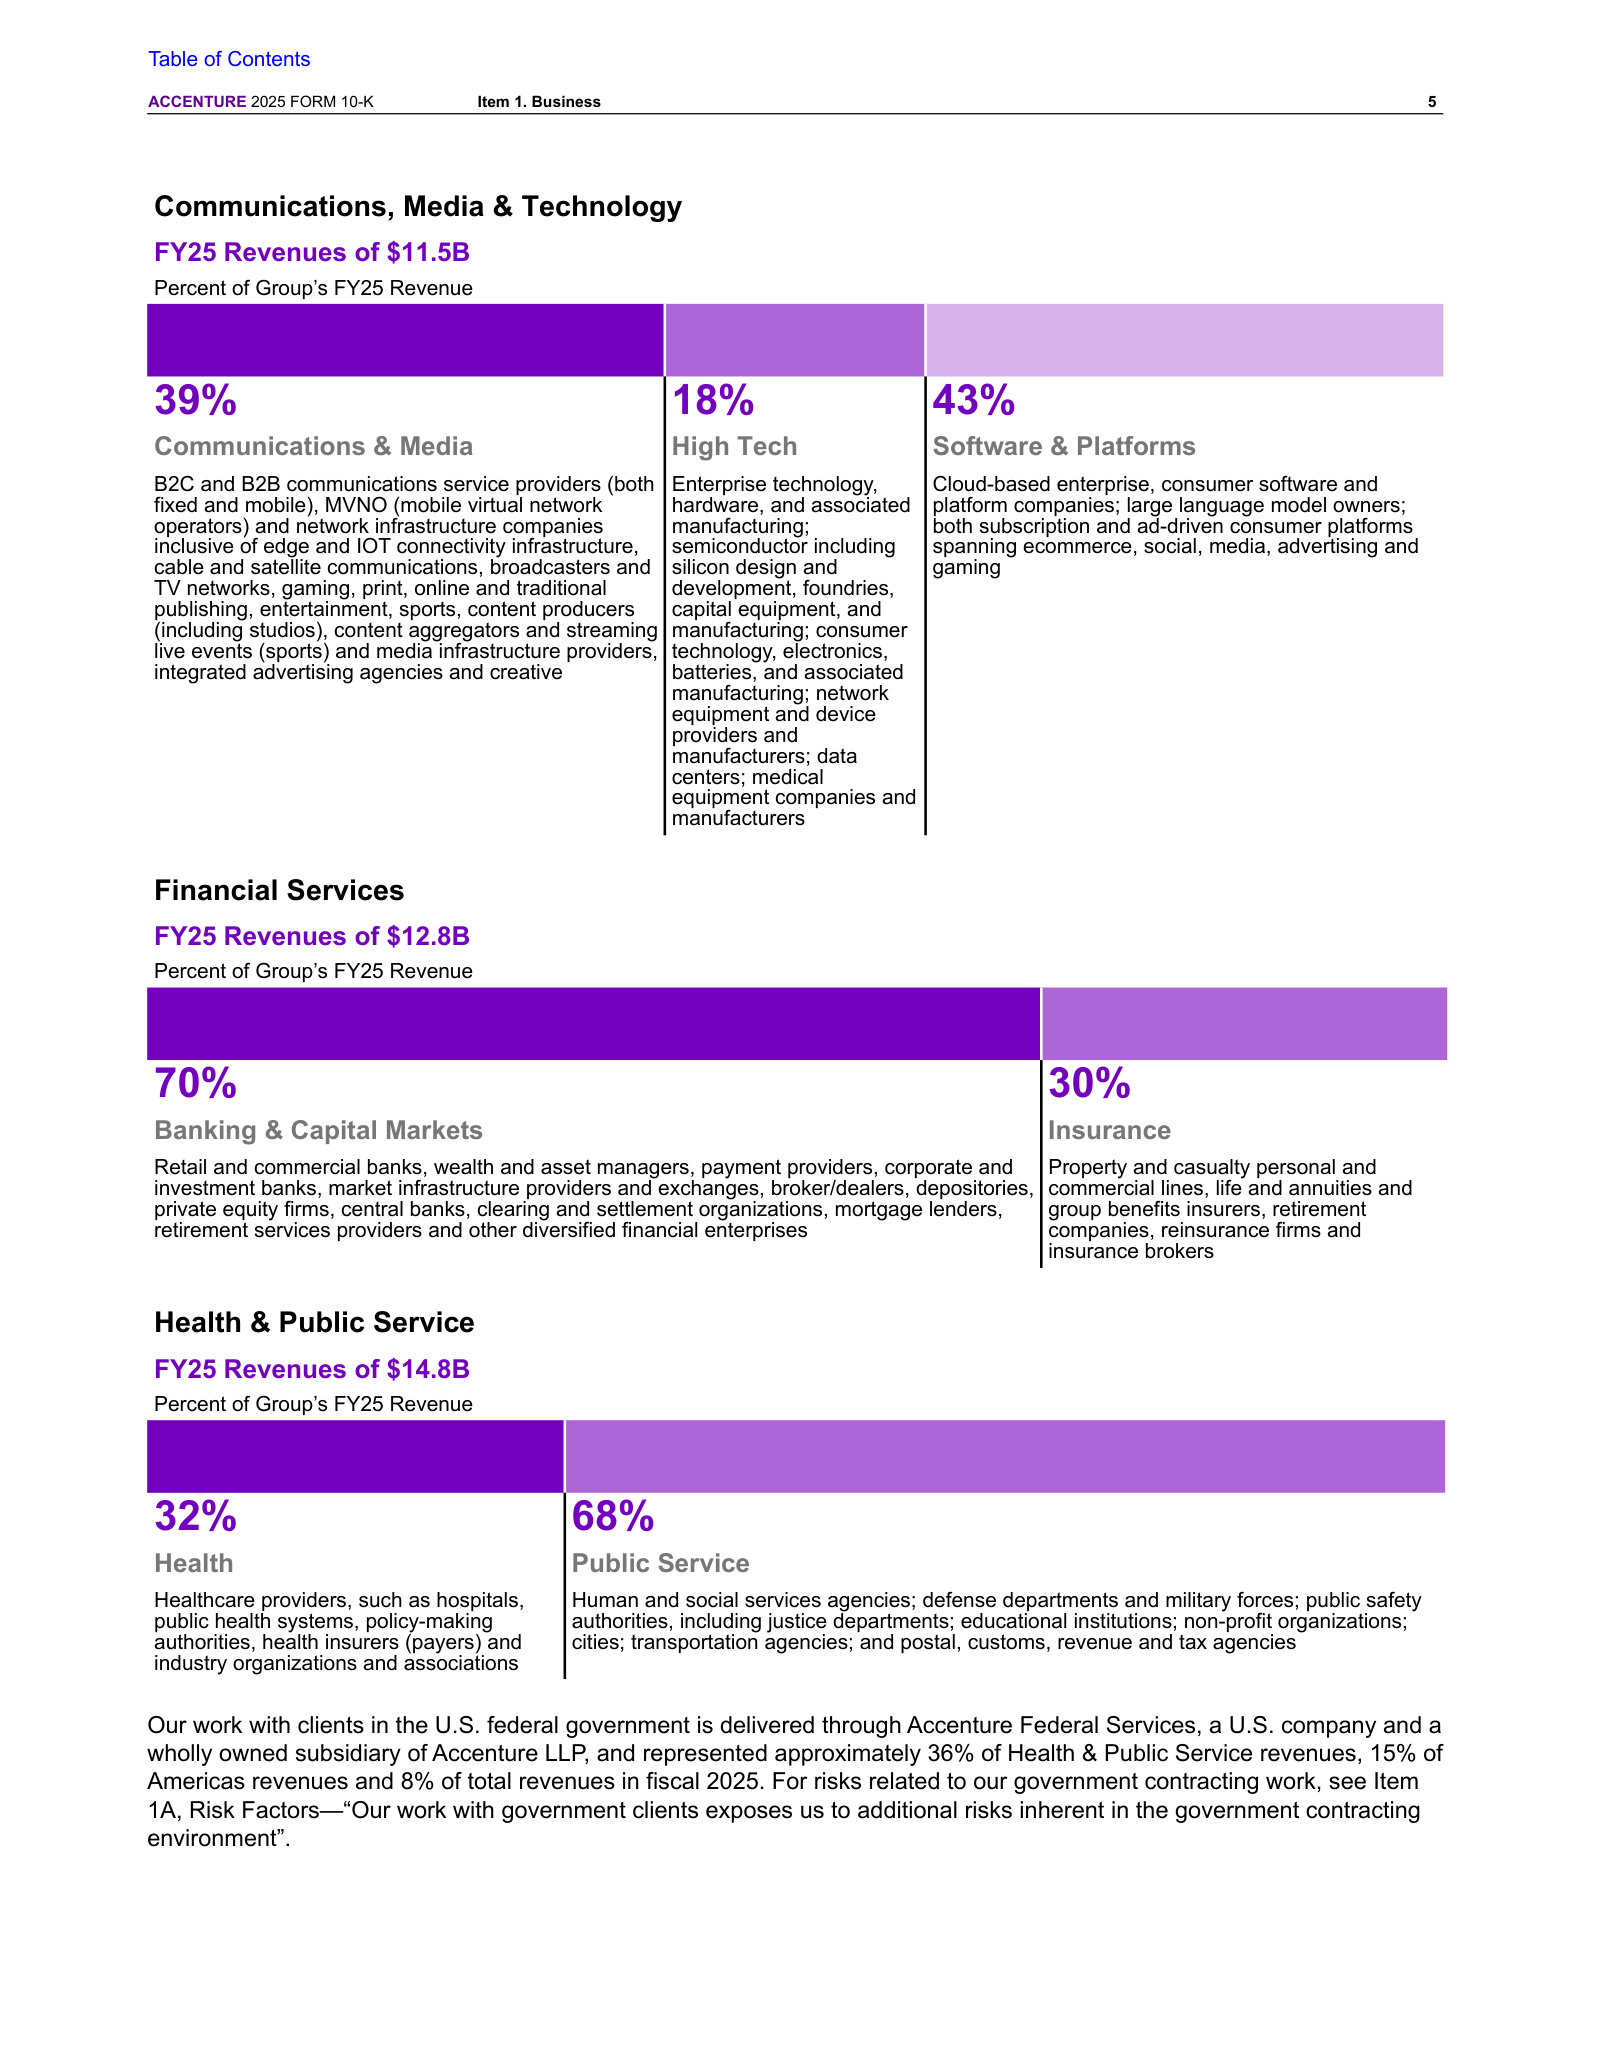
Size of the U.S. federal business, disclosed as a share of group, market and total revenues.
Our work with clients in the U.S. federal government is delivered through Accenture Federal Services, a U.S. company and a wholly owned subsidiary of Accenture LLP, and represented approximately 36% of Health & Public Service revenues, 15% of Americas revenues and 8% of total revenues in fiscal 2025.
p. 25 · Read in context →
People — p. 26 · Read the full section →
A 779,000-person workforce is the cost base; this is where the fiscal 2025 talent reset is stated in plain terms.
The refreshed three-pronged talent strategy, including exits on a compressed timeline.
We are implementing a refreshed three-pronged talent strategy to meet current and future client demand: investing in upskilling people, which has been and continues to be our primary focus; exiting people in a compressed timeline where reskilling is not a viable path for the skills we need; and identifying areas to drive even more operating efficiencies in our business, including through AI.
p. 26 · Read in context →
Item 1A. Risk Factors — Risks and uncertainties related to the development and use of AI — p. 32 · Read the full section →
The risk that AI substitutes for the billable work Accenture sells, written by the company that is also selling AI.
Item 1A. Risk Factors — If we do not successfully manage and develop our relationships with our ecosystem partners — p. 35 · Read the full section →
Accenture states that a very significant portion of its revenue rests on partners' technology — partners who also compete with it.
Dependence on ecosystem partners, and the ways that dependence can turn.
We have alliances with companies whose capabilities complement our own. A very significant portion of our revenue and solutions and services are based on technology, including platforms and software, provided by our ecosystem partners. […] The business that we conduct through these alliances could decrease or fail to grow for a variety of reasons. The priorities and objectives of our ecosystem partners may differ from ours. They offer solutions and services that compete with some of our solutions and services. They may also form closer or preferred arrangements with our competitors.
p. 35 · Read in context →
Item 1A. Risk Factors — Our work with government clients exposes us to additional risks inherent in the government contracting environment — p. 42 · Read the full section →
Pairs with the MD&A: the federal business is 8% of revenue and is being audited, repriced and terminated at the same time.
Audit and cost-recovery exposure on government contracts, including retroactive rate adjustments.
Government entities, particularly in the United States, often reserve the right to audit our contract costs and conduct inquiries and investigations of our business practices and compliance with government contract requirements. U.S. government agencies, including the Defense Contract Audit Agency, routinely audit our contract costs, including allocated indirect costs, for compliance with the Cost Accounting Standards and the Federal Acquisition Regulation. These agencies also conduct reviews and investigations and make inquiries regarding our accounting, information technology and other systems in connection with our performance and business practices with respect to our government contracts. Negative findings from existing and future audits, investigations or inquiries, or failure to comply with applicable IT security, supply chain, or other requirements, could affect our future sales and profitability by preventing us, by operation of law or in practice, from receiving new government contracts for some period of time, or result in other adverse consequences described in the following paragraphs. In addition, if the U.S. government concludes that certain costs are not reimbursable, have not been properly determined or are based on outdated estimates of our work, then we will not be allowed to bill for such costs, may have to refund money that has already been paid to us or could be required to retroactively and prospectively adjust previously agreed to billing or pricing rates for our work.
p. 42 · Read in context →
Item 7. Management's Discussion and Analysis — Overview and Key Metrics — p. 51 · Read the full section →
Management names what is acting on results — an unchanged discretionary environment and cuts to U.S. federal spending.
Demand conditions and the stated effect of U.S. federal spending reductions on Accenture Federal Services.
Our results of operations are affected by economic conditions, including macroeconomic conditions, the overall inflationary environment, new and rapidly changing technologies, and levels of business confidence. We continue to see significant economic and geopolitical uncertainty in many markets around the world, which has impacted and may continue to impact our business. While the discretionary environment is unchanged, clients continue to prioritize large-scale transformations, which include becoming AI-ready. In addition, the U.S. administration is reducing federal spending and the size of the federal workforce under the guidance of the Department of Government Efficiency. We are seeing impacts from these efforts in our federal government business (“Accenture Federal Services, or AFS”), including delays in new procurements, reductions in price and contract scope, and contract terminations. These changes have had an adverse effect on AFS’s results and could in the future have a material impact on our results of operations or financial condition.
p. 51 · Read in context →
Why the $80.6 billion bookings number and the $34 billion of remaining performance obligations are not the same thing.
The majority of our contracts are terminable by the client on short notice with little or no termination penalties, and some without notice. Only the non-cancelable portion of these contracts is included in our remaining performance obligations disclosed in Note 2 (Revenues) to our Consolidated Financial Statements under Item 8, “Financial Statements and Supplementary Data.” Accordingly, a significant portion of what we consider contract bookings is not included in our remaining performance obligations.
p. 54 · Read in context →
Accenture plc — FY2024 Annual Report (Form 10-K) — FY2024
The edition just before the reset: five separately named services and the old North America / EMEA / Growth Markets segments. · Open the full document →
Our Strategy — p. 23 · Read the full section →
The prior strategy statement, organized around 360° value and a combination of five distinct services — the framing FY2025 replaces.
The fiscal 2024 growth strategy, built on 360° value and five separately named services.
The core of our growth strategy is to be our clients’ reinvention partner of choice, delivering 360° value to our clients, people, shareholders, partners and communities. Our strategy defines the areas in which we will drive growth, build differentiation and enable our clients to transform their organizations through technology, data and AI to create value every day. We aspire to be at the center of our clients’ business and help them reach new levels of performance and to set themselves apart as leaders in their industries. […] Our clients turn to us to help them drive reinvention with our unique combination of services across Strategy & Consulting, Technology, Operations, Industry X and Song. Our strategists and deep industry, functional, customer and technology consultants work hand-in-hand with our clients and across services to shape and deliver these reinventions.
p. 23 · Read in context →
More annual reports
Accenture plc — 360° Value Report 2025 — FY2025 · 69 pages · Companion to the FY2025 annual report, not an edition of it: the client, talent and sustainability data behind the 360° value language. · Open →
Accenture plc — FY2023 Annual Report (Form 10-K) — FY2023 · 119 pages · The year of the $3 billion generative-AI commitment and $2.5 billion of acquisitions, with strategy still framed as 360° value. · Open →
Accenture plc — FY2022 Annual Report (Form 10-K) — FY2022 · 99 pages · The 10-K on its own, before the shareholder letter was bound in; Song appears here as the renamed Interactive business. · Open →
Accenture plc — 2021 Irish Statutory Accounts (Directors' Report and Consolidated Financial Statements) — FY2021 · 102 pages · Not a 10-K but the Irish-law filing for the same year: parent-company statements and directors' disclosures the 10-K omits. · Open →
Competitors describe Accenture plc's market in their own filings and calls. These verified passages and visual pages show where their strategies meet, using source documents preserved in Sources.
IBM (IBM)
IBM Consulting is the closest large Western analogue to Accenture's technology-and-consulting model, names Accenture first among the competitors of its Consulting segment in its own 10-K, and is the only peer that publishes a cumulative generative-AI 'book of business' split between software and consulting - the nearest public comparator to Accenture's GenAI bookings disclosure.
IBM's stated cumulative generative-AI book of business at the end of 2025: over $12.5bn inception-to-date, of which more than $10.5bn sits in consulting rather than software. IBM's own framing is that the pairing of a technology stack with consulting at scale is the differentiator.
Arvind Krishna, Chairman, President and Chief Executive Officer: The breadth of our AI offerings is another key differentiator. Combining an innovative technology stack with consulting at scale, and our client zero journey. Our cumulative Gen AI book of business now stands at over $12.5 billion, of which software is more than $2 billion and consulting is more than $10.5 billion, with both seeing their largest quarterly increase to date.
p. 2 · Read in context →
IBM's stated GenAI penetration of its consulting business in Q1 2026 - about 40% of signings, 30% of backlog, over 20% of revenue and $4bn of ARR - plus its claim that 80% of the GenAI book comes from clients newly captured.
James Kavanaugh, Senior Vice President and Chief Financial Officer: Consulting. Consulting is about 40% of our signings, 30% of our backlog is GenAI now, over 20% of our revenue. And on an ARR revenue perspective, in the first quarter, we eclipsed $4 billion ARR. […] 80% of our GenAI book of business right now is coming from capture from net new clients overall.
p. 12 · Read in context →
Cognizant Technology Solutions (CTSH)
The US-listed peer whose service mix overlaps Accenture's most directly, and the one whose 10-K enumerates the fullest named list of direct competitors - Accenture at the head of it, alongside every other peer on this tab. Its calls are also where the share-shift question inside the IT services market gets asked most bluntly.
Cognizant's own definition of its competitive set in its FY2025 10-K. Accenture heads the named list of direct competitors, alongside every other peer featured on this tab, and the filing sets out the factors Cognizant believes decide these contests.
Cognizant Technology Solutions Corporation, Form 10-K (FY2025), Item 1 - Competition: The markets for our services are highly competitive, characterized by a large number of participants and subject to rapid change. Competitors may include systems integration firms, contract programming companies, application software companies, cloud computing service providers, traditional consulting firms, professional services groups of computer equipment companies, infrastructure management companies, outsourcing companies, boutique digital companies and clients' in-house technology resources, such as GCCs. Our direct competitors include, among others, Accenture, Atos, Capgemini, CGI, Deloitte Digital, DXC Technology, EPAM Systems, Genpact, HCL Technologies, IBM Consulting, Infosys Technologies, Tata Consultancy Services and Wipro. […] The principal competitive factors affecting the markets for our services include the provider’s reputation and experience, strategic advisory capabilities, digital and AI capabilities, performance and reliability, responsiveness to customer needs, financial stability, corporate governance and competitive pricing of services.
p. 18 · Read in context →
Cognizant's stated Q1 2026 bookings momentum - 21% growth, seven deals of $100m+ TCV and one above $500m - framed by management around its 'AI builder' positioning.
Ravi Kumar, Chief Executive Officer: I believe our work to become the world's permanent AI builder is resonating, demonstrated by our first quarter performance. […] Q1 bookings grew 21% year-over-year. We signed 7 large deals with TCV of $100 million or greater, including 1 mega deal valued at more than $500 million.
p. 1 · Read in context →
An analyst puts the share-shift question directly - bookings growing well ahead of the industry - and asks whether the share is being bought with margin. Cognizant's CEO answers both: the deals were 'properly priced', and he attributes the wins to a repeatable large-deal template, rising win rates and self-originated deals. The elision drops only the CEO's opening aside.
Amit Jawaharlaz Daryanani (analyst), and Ravi Kumar Singisetti, Chief Executive Officer: And then if you go back to the bookings growth, I think bookings were up like 18%. And clearly, the industry is not growing at that rate. So it's fair to assume that your folks are picking up a good better market share over here. I'm curious, what do you attribute the share gains to? And are these share gains coming at potentially a lower margin point, at least initially versus what you traditionally get? […] We have successfully won competitive deals that were properly priced, and we are confident we will meet our margin targets. Looking back, last year we secured 29 deals and the year before, 17, and now we have established a strong template that is helping us improve consistently. Our win rates have seen a notable increase, allowing us to source and originate new deals. For instance, we originated a $1 billion deal ourselves, demonstrating our agility in the market.
p. 11 · Read in context →
Capgemini (CAP.PA)
The European peer whose portfolio - strategy and consulting, technology, engineering/R&D and managed operations - maps most closely onto Accenture's, and which names Accenture as a competitor in every one of the five regional markets it reports. Its 2025 Universal Registration Document is published in French; both exhibits are page images of the market and competition sections.
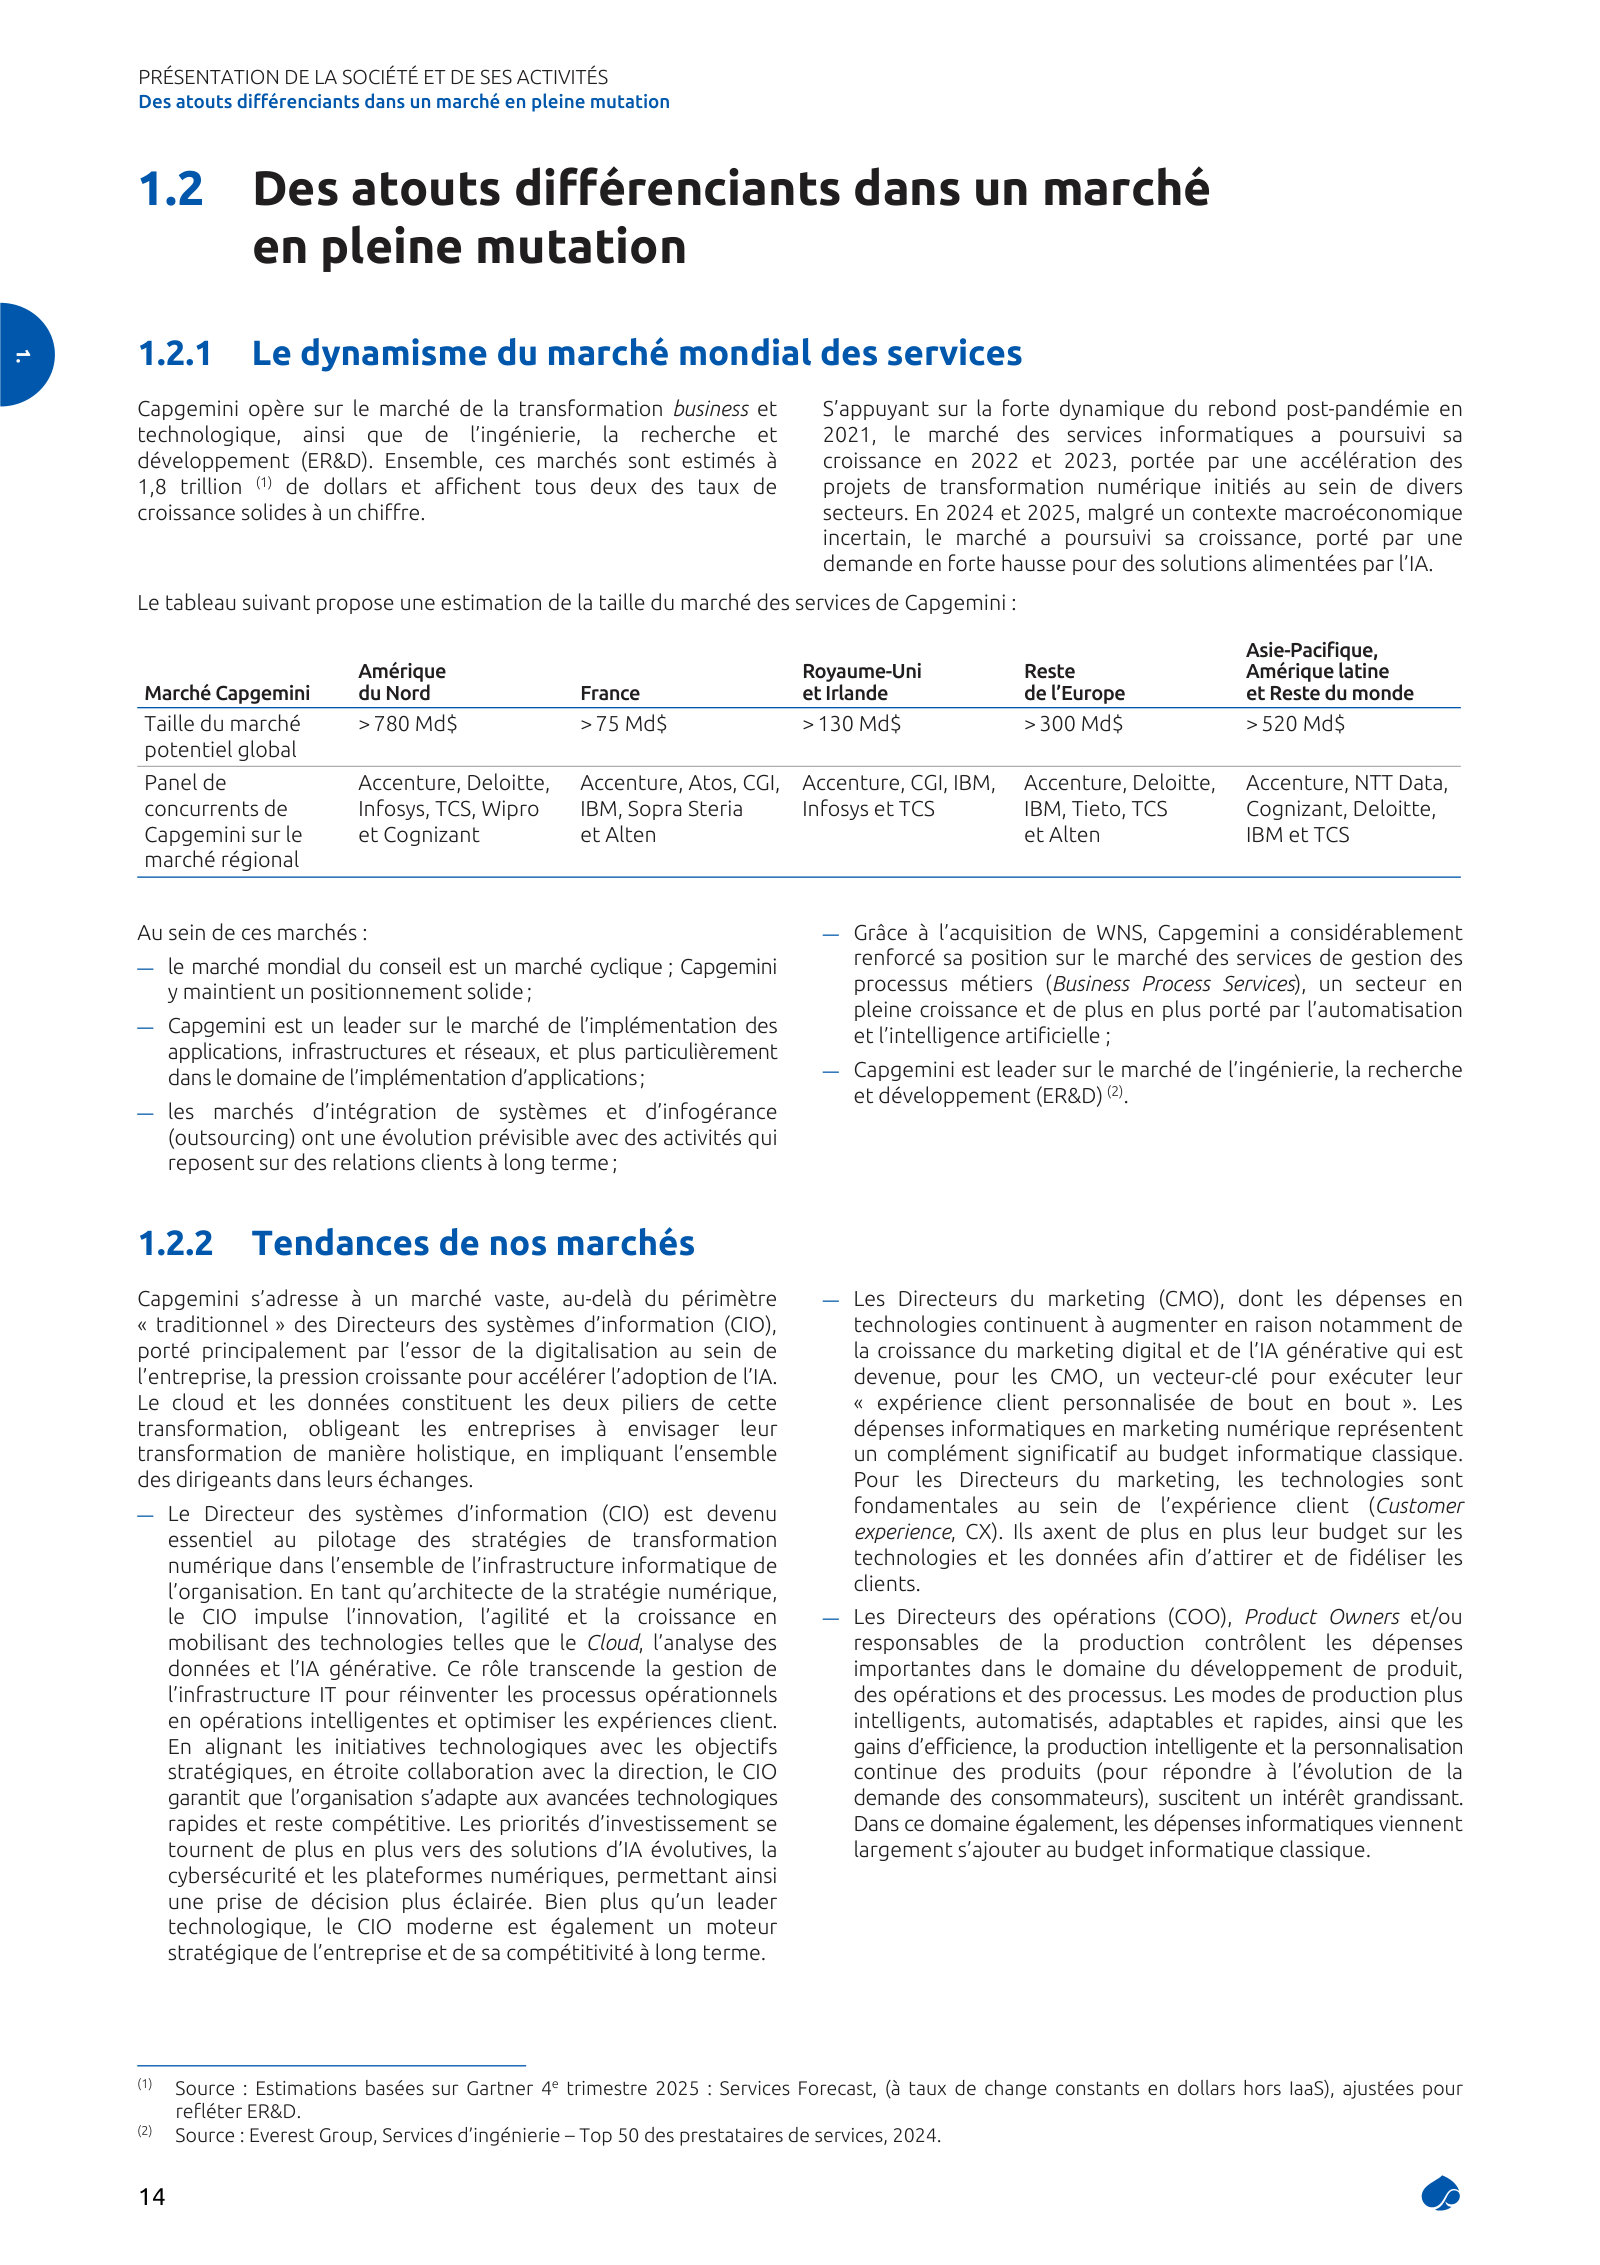
Tata Consultancy Services (TCS)
The largest India-headquartered peer by revenue and headcount, and the one that has stated an explicit ambition to become the world's largest AI-led technology services company - a claim aimed at the position Accenture occupies. It is also taking the business into capital-intensive AI data centres, a direction Accenture has not followed.
TCS's stated Q1 FY27 (quarter to June 2026) order book of $9.5bn TCV and its disclosed AI services run-rate of $2.6bn annualised, growing 13.6% sequentially - the metrics TCS uses to argue it is converting AI demand. The elision drops three named deal bullets, the largest an $800m mega deal with SKF.
K Krithivasan, Chief Executive Officer and Managing Director: We delivered a TCV of $9.5 billion, including net new AI-led business transformation deals […] The third key takeaway is our AI services revenue continues to accelerate. At the end of Q1 FY27, it stands at $2.6 billion in annualized revenue, which is up 13.6% QoQ.
p. 3 · Read in context →
Infosys (INFY)
Competes with Accenture across the same large-deal, AI-transformation and managed-services pipeline, and is unusually explicit in public about two things Accenture investors care about: how big management thinks the AI services market is, and how much of AI-driven productivity gets handed back to clients in price.
A reporter anchors on the 5.5%-of-revenue AI figure Infosys gave at its Investor AI Day and asks what share it targets of the $300-400bn AI services market Infosys has cited for 2030; the CEO says Infosys is targeting 'a very good market share' of a number it sources to an external study, and declines to disclose the AI revenue behind it. Infosys's own sizing of the AI opportunity, on its own terms.
Ritu Singh, CNBC TV18, and Salil Parekh, Chief Executive Officer and Managing Director (Q4 FY26 media conference call): On AI, for instance, you told us in your investor briefing that 5.5% of the revenue in the third quarter came in from AI. The total addressable market is about $300-$400 bn. You know, in the fourth quarter, is there a number you could provide us, annualized what is the number you see? If there is more clarity you could give us, or what market share do you target from this $400 bn figure? […] So, we are targeting a very good market share from that number, which was for 2030 what we had given, the addressable market from an external study. The growth in AI services is very strong, but we have not disclosed that revenue number externally here.
p. 6 · Read in context →
The base figure behind that ambition: at its 2026 Investor AI Day, Infosys put the work inside its 'AI value framework' at 5.5% of revenue in Q3 FY26. It is a self-defined perimeter, not a reported segment, and the only AI revenue number Infosys has quantified publicly.
Salil Parekh, Chief Executive Officer and Managing Director (Investor AI Day 2026): So what I am showing you in the Hexagon in the AI value framework is not theoretical. These are things that are actually happening on the ground with Infosys. This is what we are executing. And this for us today represents 5.5% of our revenue in Q3, and it is growing at a robust pace.
p. 10 · Read in context →
An analyst asks why productivity gains hurt rather than help margin. Infosys's CFO answers that competitive intensity has risen and AI productivity is largely passed back to clients - the pricing mechanism that decides whether AI delivery gains stay with the vendor or are competed away. The elision drops only the speaker label.
Yogesh Aggarwal (analyst), and Jayesh Sanghrajka, Chief Financial Officer: And just a quick follow-up, you mentioned productivity pass-through impacted margins. I was just wondering why should that be the case, if there was productivity improvement? […] So Yogesh, market is competitive. As I said, the competitive intensity in the market has gone up and the productivity will get passed back to the client largely.
p. 32 · Read in context →
HCLTech (HCLTECH)
Overlaps Accenture in infrastructure and digital-workplace managed services, engineering/R&D and now AI transformation, and is the peer most willing to publish its own sizing of the shared market and to name AI-driven deflation as a structural threat to the headcount-based services model.
HCLTech's stated sizing of the market it shares with Accenture - roughly $1.5 trillion of enterprise IT services by 2028 at a 4.9% CAGR - set against its own statement that the headcount-led services model is at risk from AI.
HCLTech, FY2025 Annual Report - Management Discussion and Analysis: In the near term, the technology services sector may encounter some challenges due to uncertain macroeconomic conditions globally. But the outlook remains positive over the medium to long term as technology intensity increases across the entire global economy. The industry is adjusting to changes in discretionary spending as clients develop their AI investment plans. Although a short-term slowdown may occur, the total addressable market for enterprise IT services, which is the largest segment of enterprise technology spending, is forecasted to be approximately $1.5 trillion by 2028 with a CAGR of 4.9%. […] The traditional services business model, which relies on increasing staff to boost revenue, is at risk, being challenged by the rise of AI.
p. 127 · Read in context →
HCLTech's July 2026 framing of the market in three buckets - AI-native, AI-amplified and AI-disrupted - with a stated intent to outrun the deflationary curve in the disrupted part, and $171m of quarterly 'advanced AI' revenue growing 62.1% year on year.
C. Vijayakumar, Chief Executive Officer and Managing Director: We began FY27 with a focus to grow our advanced AI-led offerings, increase our relevance with clients, capitalize on the full range of AI-related market opportunities in our pursuit of becoming the world's best AI solutions provider.
As mentioned previously, our intent is very clear, benefit disproportionately from the AI-native and AI-amplified opportunities, which together represent the fastest-growing pool of enterprise spend, while in AI-disrupted services, we intend to innovate faster than the market to stay ahead of the deflationary curve rather than be defined by it. The fruition of this is reflected in our growing advanced AI revenue. Advanced AI revenue for the quarter stood at $171 million, marking 10.6% QoQ and 62.1% YoY growth.
p. 4 · Read in context →
More peer documents
Q3_FY2025 — 14 pages · Tracks the same GenAI book of business one year earlier at over $9.5bn inception-to-date, letting you build the accumulation curve IBM reports against Accenture's. · Open →
Q2_FY2026 — 12 pages · IBM's most recent read on where enterprise AI adoption stands ("clients remain in the early stages") and on consulting demand converting from it - the July 2026 update to the GenAI book quoted above. · Open →
CTSH_annual_report_FY2024 — 148 pages · Prior-year Cognizant 10-K carrying an identically worded competitor list; useful for confirming the named rival set is stable rather than newly drafted. · Open →
Q4_FY2025 — 14 pages · Cognizant's fullest discussion of pricing pressure and deal duration, the two variables behind ACV versus TCV divergence across the peer group. · Open →
CAP_annual_report_FY2024 — 67 pages · Capgemini's English-language consolidated accounts, with 2024 revenue by region and firm bookings of EUR 23,821m - the hard numbers behind the French market section. · Open →
TCS_annual_report_FY2026 — 361 pages · TCS's FY26 integrated report sets out the five-pillar 'Infrastructure to Intelligence' strategy and the vendor-consolidation demand thesis in management's own words. · Open →
INFY_annual_report_FY2026 — 384 pages · Infosys's FY26 MD&A and risk sections cover competitive landscape, win rates and vendor consolidation - the filing-level version of the call commentary quoted above. · Open →
HCLTECH_annual_report_FY2026 — 485 pages · Page 107 carries HCLTech's FY26 net new deal wins of $9.3bn TCV and its claim to be taking a significant share of a mid-market segment it sizes at over $400bn - the flank of the shared market rather than the large-enterprise core. · Open →
Source: S&P Capital IQ consensus via Xpressfeed · Generated 2026-08-01.
The consensus tape shows a company that keeps beating and keeps getting trimmed: eight consecutive normalized-EPS beats through FY26 Q3, against FY27 and FY28 EPS estimates cut 1.4% and 2.3% over the past six months. Revenue estimates fell alongside EPS rather than diverging from it, so the cuts read as a top-line mark-down rather than a margin story. The trimming stopped roughly a month ago, with every 30-day change inside 0.1%. The street has settled at neutral: no sell ratings anywhere, but 13 analysts at hold and targets spanning USD 130 to 275.
FY28 EPS consensus is down 2.3% in six months, and revenue is down 2.4% right alongside it
Almost all of the damage landed between the six-month and three-month marks; the last 30 days are flat to marginally higher on all four lines, so the cutting cycle has paused rather than reversed. FY28 was marked down harder than FY27 on both metrics.
Currency: USD · Scale: money in millions, absolute · Point-in-time consensus; Δ90d is Now versus 90d.
| Metric | FY | 180d | 90d | 30d | Now | Δ90d |
|---|---|---|---|---|---|---|
| EPS (normalized) | FY2027 | $14.89 | $14.88 | $14.67 | $14.68 | -1.3% |
| EPS (normalized) | FY2028 | $16.16 | $16.12 | $15.78 | $15.79 | -2.0% |
| Revenue | FY2027 | $77.95bn | $78.00bn | $76.64bn | $76.61bn | -1.8% |
| Revenue | FY2028 | $82.72bn | $82.75bn | $80.70bn | $80.77bn | -2.4% |
Eight straight normalized-EPS beats, but revenue just missed for the first time in the visible record
Normalized EPS has cleared consensus in all eight captured quarters, by as much as 5.9% in FY26 Q1, which reads as conservative guidance. Revenue beat seven times before coming in 0.2% light in FY26 Q3 — the first crack, and it lines up with the period when forward revenue estimates were cut.
Current sequences by metric: Revenue: 1 consecutive miss; EPS (normalized): 8 consecutive beats.
Currency: USD · Scale: money in millions, absolute · Consensus is captured before each actual first became effective.
| Quarter | Metric | Consensus | Actual | Surprise | Outcome |
|---|---|---|---|---|---|
| Q3 FY2026 | Revenue | $18.75bn | $18.72bn | -0.2% | Miss |
| Q3 FY2026 | EPS (normalized) | $3.71 | $3.80 | +2.5% | Beat |
| Q2 FY2026 | Revenue | $17.84bn | $18.04bn | +1.1% | Beat |
| Q2 FY2026 | EPS (normalized) | $2.84 | $2.93 | +3.3% | Beat |
| Q1 FY2026 | Revenue | $18.53bn | $18.74bn | +1.1% | Beat |
| Q1 FY2026 | EPS (normalized) | $3.72 | $3.94 | +5.9% | Beat |
| Q4 FY2025 | Revenue | $17.36bn | $17.60bn | +1.4% | Beat |
| Q4 FY2025 | EPS (normalized) | $2.97 | $3.03 | +2.0% | Beat |
| Q3 FY2025 | Revenue | $17.32bn | $17.73bn | +2.3% | Beat |
| Q3 FY2025 | EPS (normalized) | $3.32 | $3.49 | +5.0% | Beat |
| Q2 FY2025 | Revenue | $16.61bn | $16.66bn | +0.3% | Beat |
| Q2 FY2025 | EPS (normalized) | $2.81 | $2.82 | +0.3% | Beat |
| Q1 FY2025 | Revenue | $17.14bn | $17.69bn | +3.2% | Beat |
| Q1 FY2025 | EPS (normalized) | $3.42 | $3.59 | +5.1% | Beat |
| Q4 FY2024 | Revenue | $16.38bn | $16.41bn | +0.2% | Beat |
| Q4 FY2024 | EPS (normalized) | $2.77 | $2.79 | +0.6% | Beat |
EPS is set to outgrow revenue in every forward year as gross margin edges from 32.0% to 32.3%
Consensus revenue growth troughs in FY27 before FY28 reaccelerates, while normalized EPS compounds faster than revenue in each year. Note the coverage asymmetry: EBITDA is carried by 9 to 11 analysts against 19 to 28 on revenue and EPS, so the margin line is the thinnest part of the forward view. Driver-level detail behind these lines sits in the Visible Alpha tab.
Currency: USD · Scale: money in millions, absolute · YoY uses the prior fiscal year from the feed; analyst count and range use the first displayed period.
| Metric | FY2026E | FY2027E | FY2028E | YoY | Analysts | Low / high |
|---|---|---|---|---|---|---|
| Revenue | $73.56bn | $76.61bn | $80.77bn | +5.6% | 23 | $73.32bn / $74.00bn |
| EPS (normalized) | $13.87 | $14.68 | $15.79 | +7.3% | 27 | $13.79 / $14.13 |
| EBITDA | $14.02bn | $14.85bn | $15.82bn | +5.5% | 11 | $13.67bn / $14.77bn |
| Gross margin | 32.0% | 32.1% | 32.3% | +0.0pt | — | — |
| Free cash flow | $11.20bn | $11.74bn | $12.58bn | +16.9% | — | — |
No sell ratings anywhere, yet 13 analysts sit at hold and targets span USD 130 to 275
Mean and median targets sit at USD 178.89 and 179 across 25 estimates, with the high more than double the low. The absence of any sell or underperform rating alongside a plurality at hold is the shape of coverage that has stopped downgrading but has not re-engaged.
Currency: USD · Scale: money in millions, absolute · Analyst counts shown explicitly.
| Street view | Reading | Analysts |
|---|---|---|
| Recommendation mix | Buy 11, Outperform 3, Hold 13, Underperform 0, Sell 0 | 27 |
| Consensus score | 2.07 | 27 |
| Target price | mean $178.9; median $179.0; high $275.0; low $130.0 | 25 |
Coverage collapses to 2 analysts at FY29
FY2029 carries just 2 estimates for revenue, normalized EPS and net income, so any outer-year growth step is two houses rather than the street. FY28 is thinner than the front years too: 21 analysts on normalized EPS spanning 14.13 to 16.90, and only 9 on EBITDA.
Visible Alpha broker models via S&P Xpressfeed · 20 brokers · 435 line items · freshest revision 2026-07-19.
Broker models describe a business whose reported growth troughs in FY-2027 at 3.88% before re-accelerating, even as constant-currency growth is already improving from 3.72% in FY-2026 to 4.16% in FY-2027. The differentiated detail sits below the P&L: Generative AI bookings compound in every modeled year while total bookings grow mid-single digits at an unchanged 1.14x book-to-bill, and Managed Services passes Consulting in the revenue mix in FY-2026. Margin is the quiet constant, with operating margin rising from 15.58% to 16.03% across the window on a delivery base the models barely grow. Where the models genuinely diverge is the size of the AI ramp and how the cash is deployed, not the near-term P&L.
Generative AI carries the bookings story — total bookings still grow mid-single digits at a 1.14x book-to-bill
Generative AI bookings rise in every modeled year, yet total bookings grow mid-single digits and book-to-bill sits at 1.14x from FY-2025 through FY-2027 — on these models AI work is more a relabelling of demand than an addition to it. Underneath, Consulting book-to-bill improves from 1.08x to 1.11x while Managed Services slips from 1.21x to 1.16x. Four brokers carry the Generative AI line from FY-2026 onward against six on the other bookings rows.
| Line | FY-2025A | FY-2026E | FY-2027E | FY-2028E | YoY | Brokers |
|---|---|---|---|---|---|---|
| Bookings | — | — | — | — | — | — |
| Total Bookings | $79.36bn | $83.60bn | $86.94bn | $91.05bn | +5.3% | 6 |
| Bookings - Generative AI | $5.13bn | $9.91bn | $15.51bn | $21.05bn | +93.2% | 4 |
| Bookings - Consulting | $37.75bn | $40.19bn | $41.48bn | $43.12bn | +6.5% | 6 |
| Bookings - Managed Services (Outsourcing) | $41.61bn | $43.41bn | $45.46bn | $47.92bn | +4.3% | 6 |
| Book-to-bill | — | — | — | — | — | — |
| Book to bill ratio - Total(x) | 1.14 Ratio | 1.14 Ratio | 1.14 Ratio | 1.13 Ratio | -0.7% | 6 |
| Book to bill ratio - Consulting(x) | 1.08 Ratio | 1.11 Ratio | 1.11 Ratio | 1.09 Ratio | +2.7% | 6 |
| Book to bill ratio - Managed Services (Outsourcing)(x) | 1.21 Ratio | 1.16 Ratio | 1.17 Ratio | 1.17 Ratio | -4.1% | 6 |
The growth dip is currency, not demand: 4QFY-2026 reported growth falls to 2.61% while constant currency holds at 2.98%
Reported growth swings from 7.52% in 2QFY-2026 to 2.61% in 4QFY-2026, while constant currency travels only from 4.37% to 2.98% over the same stretch. The swing factor is the forex line, worth 3.40% in 2QFY-2026 and -0.36% by 2QFY-2027. The constant-currency and forex rows carry 11 brokers in the forward quarters against 17 on reported growth, so read them as the smaller, more considered sample.
| Line | 4QFY-2025A | 1QFY-2026A | 2QFY-2026A | 3QFY-2026A | 4QFY-2026E | 1QFY-2027E | 2QFY-2027E | 3QFY-2027E | Brokers |
|---|---|---|---|---|---|---|---|---|---|
| Revenue | — | — | — | — | — | — | — | — | — |
| Revenue | $17.37bn | $18.53bn | $17.89bn | $18.80bn | $18.07bn | $19.38bn | $18.66bn | $19.49bn | 19 |
| Growth bridge | — | — | — | — | — | — | — | — | — |
| Revenue growth - YoY - Total(%) | 6.2% | 4.8% | 7.5% | 6.3% | 2.6% | 3.4% | 3.4% | 4.1% | 19 |
| Revenue growth - YoY - CC(%) | 3.8% | 3.8% | 4.4% | 4.1% | 3.0% | 3.8% | 3.9% | 4.1% | 14 |
| Revenue growth - YoY - Forex(%) | 2.5% | 1.1% | 3.4% | 2.4% | -0.3% | -0.3% | -0.4% | 0.0% | 14 |
Managed Services passes Consulting in the FY-2026 mix, and operating margin still grinds from 15.58% to 16.03%
Managed Services overtakes Consulting on both revenue and mix in FY-2026 and holds the lead through FY-2028, a shift toward the lower-price, longer-duration half of the business. Margin does not pay for it: gross margin edges from 32.02% to 32.30% and operating margin from 15.58% to 16.03%, on a headcount line the models take from 797,266 in FY-2025 to 829,050 in FY-2028. The staff row rests on six brokers, well below the 17 to 18 on the P&L rows above it.
| Line | FY-2025A | FY-2026E | FY-2027E | FY-2028E | YoY | Brokers |
|---|---|---|---|---|---|---|
| Mix | — | — | — | — | — | — |
| Revenue - Managed Services (Outsourcing) | $34.38bn | $37.18bn | $38.75bn | $40.80bn | +8.1% | 11 |
| Revenue - Consulting | $35.03bn | $36.42bn | $37.70bn | $39.47bn | +4.0% | 11 |
| Revenue mix - Managed Services (Outsourcing)(%) | 49.5% | 50.5% | 50.7% | 50.8% | +1.0pt | 11 |
| Revenue mix - Consulting(%) | 50.5% | 49.5% | 49.3% | 49.2% | -1.0pt | 11 |
| Margin | — | — | — | — | — | — |
| Gross margin(%) | 32.0% | 32.0% | 32.2% | 32.3% | -0.0pt | 19 |
| Operating margin(%) | 15.6% | 15.8% | 15.9% | 16.0% | +0.2pt | 19 |
| Operating income/(loss) - Operating | $10.82bn | $11.60bn | $12.14bn | $12.84bn | +7.2% | 20 |
| Delivery base | — | — | — | — | — | — |
| Staff(#) | 797,266 Number | 793,144 Number | 812,459 Number | 829,050 Number | -0.5% | 7 |
M&A does much of the growth work: organic growth is modeled at 1.85% in FY-2027 against an FY-2026 spike in deal spend
The organic line — four brokers only — is modeled at 2.09% in FY-2026 and 1.85% in FY-2027, well under the reported rate, while acquisition spend steps up sharply in FY-2026 before settling back. Repurchases are modeled lower in FY-2027 and FY-2028 than in FY-2026, so the payout ratio rises from 45.70% to 50.90% on a mix leaning more on the dividend. Cash generation is the dependable part: FCF per share moves from 14.88 to 20.67 across the window.
| Line | FY-2025A | FY-2026E | FY-2027E | FY-2028E | YoY | Brokers |
|---|---|---|---|---|---|---|
| Organic engine | — | — | — | — | — | — |
| Revenue growth - Organic(%) | 3.9% | 2.1% | 1.9% | 2.6% | -1.9pt | 7 |
| Cash deployment | — | — | — | — | — | — |
| Purchases of businesses and investments, net of cash acquired | $1.26bn | $7.49bn | $3.59bn | $3.82bn | +494.2% | 13 |
| Purchases of shares | $4.74bn | $5.98bn | $4.73bn | $4.35bn | +26.2% | 15 |
| Total payout ratio(%) | 45.7% | 47.2% | 49.7% | 50.9% | +1.5pt | 11 |
| Cash generation | — | — | — | — | — | — |
| Free cash flow | $9.41bn | $11.17bn | $11.61bn | $12.51bn | +18.8% | 15 |
| FCF per share($) | $14.88 | $18.04 | $19.07 | $20.67 | +21.2% | 14 |
The live arguments are the size of the AI ramp and the pace of buybacks — not the FY-2027 P&L
| Line | Period | Median | Q1–Q3 | Min–max | Brokers |
|---|---|---|---|---|---|
| Bookings - Generative AI | FY-2028E | $17.50bn | $14.86bn–$23.69bn | $11.45bn–$37.74bn | 4 |
| Purchases of shares | FY-2027E | $4.80bn | $4.00bn–$5.20bn | $2.50bn–$7.00bn | 13 |
| Free cash flow | FY-2027E | $11.59bn | $11.06bn–$12.15bn | $9.42bn–$13.87bn | 14 |
| Staff(#) | FY-2028E | 815,592 Number | 783,812 Number–862,444 Number | 761,994 Number–929,843 Number | 6 |
The most differentiated lines here are also the thinnest-covered
Generative AI bookings and organic revenue growth carry four brokers, and staff and total bookings six, against 17 on revenue and 18 on operating income. Utilization is a single-broker line and attrition a two-broker line, so neither is consensus and neither is shown here. Consensus was last updated 2026-07-19, but the bookings and organic rows were last revised 2026-06-28 and 2026-06-19 respectively, so they predate the newest P&L marks.
Headline P&L consensus, momentum and beat/miss live in the CapIQ tab.
Source: S&P Capital IQ transcripts via Xpressfeed · latest indexed call 2026-06-18 · generated 2026-08-01.
Latest call digest
Accenture plc, Q3 2026 Earnings Call, Jun 18, 2026 · 2026-06-18T12:00:00
Q3 FY2026 — reported June 18, 2026. Revenue of $18.7 billion grew 3% in local currency (6% in USD), about 4% excluding the federal business. Bookings were $19.3 billion, down 3% in local currency, for a 1.0 book-to-bill; consulting bookings of $10.3 billion held a 1.1 book-to-bill while managed services bookings of $9.1 billion came in at 1.0. Operating margin was 17%, up 20 basis points; EPS of $3.80 grew 9%; free cash flow was $3.6 billion.
The prepared remarks and the Q&A pulled in different directions. Management opened on strategy — a majority stake in Dragos plus runZero and NetRise to build an OT security platform ($208 million of ARR growing 48%), a new mid-market business called Accenture Edge targeting what they size as a $240 billion market, and capital deployment raised to approximately $9 billion for the year from the $5 billion flagged in March. The quarter's two negatives were disclosed but not dwelt on: roughly $100 million of revenue impact from the Middle East conflict, all in consulting type of work and split evenly between direct and indirect effects, plus approximately $400 million of sales impact in the region; and a couple of large managed services opportunities slipping into FY27 for company-specific reasons.
The Q&A went straight at those two items and stayed there. Analysts pressed on whether the Middle East drag persists into Q4, on the size of the managed services pushout, on why consulting bookings strength is not showing up in consulting revenue, and on what protects the bottom line if revenue lands at the low end. Julie Sweet's answer to Morgan Stanley's request to sensitize the Q4 range was a single line of confirmation.
Guidance as actually stated: Q4 revenue of $17.75–$18.4 billion, 1% to 5% growth in local currency, with the federal headwind anniversarying and that business returning to growth. Full-year FY26 revenue was trimmed to 3% to 4% local-currency growth from 3% to 5%; adjusted operating margin was set at 15.8% (20 basis points of expansion) versus the prior 15.7%–15.9% range; adjusted EPS was narrowed and raised at the bottom to $13.78–$13.90; free cash flow of $10.8–$11.5 billion and at least $9.5 billion of shareholder returns were maintained or raised. The tax-rate range moved up to 24%–25%. Angie Park said the company expects to enter FY27 slightly below 2% of inorganic contribution, and flagged an intention to access the long-term debt market to fund the elevated acquisition outlook. An Investor Day was announced for New York City on October 14.
Participant coverage from the latest call.
| Group | Participants | Count |
|---|---|---|
| Management | Operator; Alexia Quadrani — Executive Director of Investor Relations, Accenture plc; Julie T. Sweet — CEO & Chairman, Accenture plc; Angie Park — Chief Financial Officer, Accenture plc | 4 |
| Analysts | Bryan Keane — Research Analyst, Citigroup Inc., Research Division; Tien-Tsin Huang — Senior Analyst, JPMorgan Chase & Co, Research Division; Jason Kupferberg — Managing Director & Senior Equity Analyst, Wells Fargo Securities, LLC, Research Division; Kevin McVeigh — Analyst, UBS Investment Bank, Research Division; James Schneider — Senior Research Analyst, Goldman Sachs Group, Inc., Research Division; David Koning — Associate Director of Research & Senior Research Analyst, Robert W. Baird & Co. Incorporated, Research Division; James Faucette — MD & Equity Analyst, Morgan Stanley, Research Division; James Friedman — Senior Analyst, Susquehanna Financial Group, LLLP, Research Division | 8 |
Curated latest-call exchanges; one row per analyst topic.
| Analyst | Firm | Topic | What changed in Q&A |
|---|---|---|---|
| Bryan Keane | Citigroup Inc., Research Division | Whether the Middle East drag fades in Q4 | Asked why macro uncertainty is still in the guide if the conflict is easing. Sweet said the indirect impact only began in the last few weeks of the quarter and sits mostly in discretionary spend, so more of the range is in play for Q4; she declined to time a recovery and pointed to automotive as an industry already challenged before the conflict. |
| Bryan Keane | Citigroup Inc., Research Division | Size and timing of the managed services pushout | Framed the shortfall as roughly $2 billion below his model and asked whether it lands in Q4. Sweet said the larger deals moved to FY27, not Q4, and that Q4 should not be modeled as materially larger as a result — a direct answer that closed off the easiest bull case on bookings. |
| Tien-Tsin Huang | JPMorgan Chase & Co, Research Division | Integration risk and dilution in the three OT security acquisitions | Asked about above-average risk in stitching three assets together and about initial dilution. Sweet addressed market size, Dragos's platform maturity and the single-contract benefit to clients, and said she does not see stitching risk at all. The dilution part of the question was not answered. |
| Tien-Tsin Huang | JPMorgan Chase & Co, Research Division | What protects earnings if revenue lands at the low end | Asked specifically what levers exist to defend the bottom line given ongoing investment. Park redirected to the FY27 exit-rate building blocks — inorganic contribution, the federal anniversary, the FY27 deal timing, the conflict — and reaffirmed margin and EPS expansion for the year. No cost lever was named. |
| Jason Kupferberg | Wells Fargo Securities, LLC, Research Division | Consulting bookings strength versus tepid consulting revenue | The sharpest fundamental question of the call, raised on an LTM basis rather than a single quarter. Park attributed the gap to the Middle East impact, all of which fell in consulting, and pointed to four consecutive quarters of consulting bookings growth plus the federal return to growth as the Q4 catalysts. Sweet added that consulting content is growing inside large managed services programs. |
| Kevin McVeigh | UBS Investment Bank, Research Division | What $9 billion of acquisitions contributes in FY27 | Park said the deals should put the company slightly under 2% of inorganic contribution entering FY27. Sweet used the answer to make the strategic point — the cyber assets carry $208 million of ARR growing 48% — framing acquisitions as the route into higher-growth, non-FTE revenue. |
| James Schneider | Goldman Sachs Group, Inc., Research Division | Whether AI infrastructure and token spend crowds out services budgets | Sweet said the company is building a token-optimization practice on the model of its cloud FinOps business, does not see token spend as material to services demand today, and stated plainly that client budgets have not been increasing — which is why TAM expansion into OT security and the mid-market matters. |
| James Faucette | Morgan Stanley, Research Division | Scenarios behind the Q4 range, and margin implications of product acquisitions | On the first question, Sweet confirmed the analyst's own framing — deterioration at the low end, improvement at the high end — in a single sentence. On the second, she described the acquisition mix and rising valuations but did not address the long-term margin trajectory that was asked about. |
| James Friedman | Susquehanna Financial Group, LLLP, Research Division | Fixed-price mix and its margin characteristics | Park said fixed price remains above 60% and continues to increase, with no meaningful margin difference between consulting and managed services, and that it is embedded in the 20 basis points of expansion guided for the year. |
| David Koning | Robert W. Baird & Co. Incorporated, Research Division | FY27 margin expansion cadence | Asked whether the usual 10 to 30 basis points still applies given the new acquisitions. Park declined to guide and restated the standing goal of improved gross margin and SG&A while investing — a notable non-answer given the company volunteered an FY27 inorganic figure earlier in the same call. |
Theme tracker
Themes are curator-classified across supplied calls.
| Theme | Status | Quarters mentioned | Read-through |
|---|---|---|---|
| Reinvention and large-scale transformation as the demand anchor | persisted | Q4 2023, Q1 2024, Q2 2024, Q3 2024, Q4 2024, Q1 2025, Q2 2025, Q3 2025, Q4 2025, Q1 2026, Q2 2026, Q3 2026 | The single most stable element of the story across all twelve calls, with the $100 million-plus quarterly client bookings count used throughout as the proxy. It matters because it is the one metric management has never reframed or retired, which makes it the cleanest series for judging whether the strategy is still working. |
| Constrained discretionary spend | persisted | Q4 2023, Q1 2024, Q2 2024, Q3 2024, Q4 2024, Q1 2025, Q2 2025, Q3 2025, Q4 2025, Q1 2026, Q3 2026 | Present in nearly every call since FY23 and never resolved. What changed is the framing: through FY25 it was described as a market that would eventually improve, and by Q3 2026 it was described as a multi-year industry challenge to be structurally offset by entering the mid-market. |
| Advanced AI bookings and revenue disclosure | dropped | Q4 2023, Q1 2024, Q2 2024, Q3 2024, Q4 2024, Q1 2025, Q2 2025, Q3 2025, Q4 2025, Q1 2026 | Disclosed every quarter from FY23 and explicitly retired in Q1 2026, with a cumulative total of roughly $11.5 billion of bookings and $4.8 billion of revenue given as the final data point. Management's stated reason is that advanced AI is now embedded in nearly everything. The effect is that the most direct external check on AI monetization is gone, replaced by the broader top-10 ecosystem partner metric. |
| U.S. federal (AFS) headwind | persisted | Q2 2025, Q3 2025, Q4 2025, Q1 2026, Q2 2026, Q3 2026 | Emerged abruptly in Q2 2025 with the GSA contract review and has been quantified in the guide every quarter since. Q3 2026 guidance has it anniversarying and returning to growth in Q4, which removes roughly a point of drag but also removes an explanation management has leaned on for two years. |
| Non-FTE commercial models and product-led acquisitions | emerged | Q2 2026, Q3 2026 | Ookla and Faculty introduced the idea in Q2 2026; the OT security platform deals in Q3 2026 made it the organizing logic of capital deployment, alongside the raise from about $5 billion to about $9 billion. This is the clearest change in the equity story in the twelve-call window and the least tested. |
| Mid-market expansion | emerged | Q2 2026, Q3 2026 | Two mid-market acquisitions were disclosed in Q2 2026, and Q3 2026 launched Accenture Edge as a distinct business with a lighter client coverage model. Management ties it directly to offsetting the small-deal weakness that has held back consulting for several years. |
| Cybersecurity as a growth engine | persisted | Q4 2024, Q1 2025, Q2 2025, Q3 2025, Q4 2025, Q1 2026, Q2 2026, Q3 2026 | A recurring growth callout across the window — $9 billion of revenue growing 23% in FY24, 16% growth in FY25, very strong double digits in Q1 2026 — supported by the CyberCX acquisition and now the OT platform deals. Q3 2026 changed its role from a services line to the anchor of a platform business, which is a different risk profile than the growth commentary that preceded it. |
| Fixed-price mix above 60% of work | emerged | Q1 2026, Q2 2026, Q3 2026 | First quantified in Q1 2026 as about 60% of FY25 work, up roughly 10 points over three years, and repeated in each call since as evidence of commercial-model evolution. It is the mechanism management points to when asked how AI productivity gains are retained rather than passed through. |
| Tariffs and policy-driven uncertainty | dropped | Q2 2025, Q3 2025, Q4 2025 | A recurring analyst and management topic for three consecutive calls, then absent from Q1 2026 onward. The uncertainty language did not disappear so much as change subject, moving to the Middle East conflict from Q2 2026. |
| Per-quarter growth callouts for Song and Industry X | dropped | Q1 2025, Q2 2025, Q4 2025, Q1 2026 | Growth rates for these two businesses were given regularly through Q1 2026 and are absent from both Q2 2026 and Q3 2026; Song is not mentioned at all in the latest call. Two quarters is a short absence, so this is worth watching rather than concluding on, but it coincides with the disclosure shift toward ecosystem and TAM metrics. |
| Middle East conflict | emerged | Q2 2026, Q3 2026 | Introduced in Q2 2026 as a risk with no significant financial impact, and quantified in Q3 2026 at roughly $100 million of revenue and approximately $400 million of sales. It is the proximate reason the FY26 revenue range was trimmed and the stated reason more of the Q4 range is in play. |
| Top-10 ecosystem partner revenue metric | persisted | Q4 2025, Q1 2026, Q2 2026, Q3 2026 | Introduced at the end of FY25 as 60% of revenue growing faster than the company overall, and explicitly designated in Q1 2026 as the metric that survives the retirement of the advanced AI disclosure. It is now the primary quantitative proxy management offers for AI-driven demand. |
Guidance ledger
Quotes, calls, and speakers are source-verified; outcomes are curator-classified.
| Verbatim guidance | Call | Speaker | Curator outcome | Outcome note |
|---|---|---|---|---|
| “For the full fiscal '25, we expect our revenue to be in the range of 3% to 6% growth in local currency over fiscal '24, which includes an inorganic contribution of a bit more than 3%.” | Accenture plc, Q4 2024 Earnings Call, Sep 26, 2024 · 2024-09-26T12:00:00 | Angie Park | kept | FY25 finished at 7% local-currency growth per the Q4 2025 call, above the top of the original range. Guidance was raised twice during the year. |
| “For operating margin, we expect fiscal year '25 to be 15.6% to 15.8%, a 10 to 30 basis point expansion over adjusted fiscal '24 results.” | Accenture plc, Q4 2024 Earnings Call, Sep 26, 2024 · 2024-09-26T12:00:00 | Angie Park | kept | Adjusted operating margin came in at 15.6%, a 10 basis point expansion — the bottom of the range, after the range was trimmed to 15.6%-15.7% in Q2 2025 and to 15.6% in Q3 2025. |
| “We expect our full year diluted earnings per share for fiscal '25 to be in the range of $12.55 to $12.91 or 5% to 8% growth over adjusted fiscal '24 results.” | Accenture plc, Q4 2024 Earnings Call, Sep 26, 2024 · 2024-09-26T12:00:00 | Angie Park | kept | Adjusted EPS of $12.93 was reported for FY25, 8% growth and slightly above the top of the original range. |
| “For the full fiscal '25, we now expect our revenue to be in the range of 5% to 7% growth in local currency over fiscal '24.” | Accenture plc, Q2 2025 Earnings Call, Mar 20, 2025 · 2025-03-20T12:00:00 | Angie Park | kept | Delivered at the top of this range at 7% local-currency growth, despite the federal disruption disclosed on the same call. |
| “For operating margin, we now expect fiscal year '25 to be 15.6%, a 10 basis point expansion over adjusted fiscal '24 results.” | Accenture plc, Q3 2025 Earnings Call, Jun 20, 2025 · 2025-06-20T12:00:00 | Angie Park | kept | Matched exactly: adjusted operating margin of 15.6% and a 10 basis point expansion were reported for FY25. |
| “For the full fiscal '26, we expect revenue to be in the range of 2% to 5% growth in local currency over fiscal '25, including an estimated 1% to 1.5% impact from our federal business.” | Accenture plc, Q4 2025 Earnings Call, Sep 25, 2025 · 2025-09-25T12:00:00 | Angie Park | pending | Raised to 3%-5% in Q2 2026 and trimmed to 3%-4% in Q3 2026, so the current guide sits inside the original range. FY26 is not complete. |
| “This year, we expect an inorganic contribution of about 1.5% and we expect to invest about $3 billion in acquisitions this fiscal year.” | Accenture plc, Q4 2025 Earnings Call, Sep 25, 2025 · 2025-09-25T12:00:00 | Angie Park | pending | The spend plan was raised to about $5 billion in Q2 2026 and to approximately $9 billion in Q3 2026, contingent on announced deals closing this fiscal year. The 1.5% inorganic contribution for FY26 has been reaffirmed at each step. |
| “We continue to expect our full year adjusted diluted earnings per share for fiscal '26 to be in the range of $13.52 to $13.90, or 5% to 8% growth over adjusted fiscal '25 results.” | Accenture plc, Q1 2026 Earnings Call, Dec 18, 2025 · 2025-12-18T13:00:00 | Angie Park | pending | Narrowed upward to $13.78-$13.90, or 7% to 8% growth, by Q3 2026. Not yet reported. |
| “For the full fiscal '26, we now expect revenues to be in the range of 3% to 5% growth in local currency over fiscal '25, including an estimated 1% impact from our Federal business.” | Accenture plc, Q2 2026 Earnings Call, Mar 19, 2026 · 2026-03-19T12:00:00 | Angie Park | pending | Cut to 3%-4% one quarter later, with the Middle East conflict and slipped managed services deals cited. The top of this raise is no longer available. |
| “For the full fiscal '26, we now expect our revenue to be in the range of 3% to 4% growth in local currency over fiscal '25, including an estimated 1% impact from our federal business.” | Accenture plc, Q3 2026 Earnings Call, Jun 18, 2026 · 2026-06-18T12:00:00 | Angie Park | pending | The current full-year guide, set alongside a Q4 range of 1% to 5% that management said has more of its span in play than usual. |
| “For adjusted operating margin, we now expect fiscal year '26 to be 15.8%, a 20 basis point expansion over adjusted fiscal '25 results.” | Accenture plc, Q3 2026 Earnings Call, Jun 18, 2026 · 2026-06-18T12:00:00 | Angie Park | pending | Points to the upper half of the original 10 to 30 basis point range set in September 2025, and was reaffirmed in the Q&A as including the fixed-price mix effect. |
| “we do expect to enter FY '27 slightly below 2% of inorganic growth” | Accenture plc, Q3 2026 Earnings Call, Jun 18, 2026 · 2026-06-18T12:00:00 | Angie Park | pending | An unusually early FY27 data point, repeated later in the call. Sweet noted it was volunteered ahead of the normal September guidance cycle. |
Q&A pressure map
Question counts and firms are curator tallies; analyst coverage shown above.
| Topic | Questions | Firms | Pressure / response |
|---|---|---|---|
| U.S. federal exposure, DOGE and the path back to growth | 10 | JPMorgan Chase & Co, Research Division, BofA Securities, Research Division, Robert W. Baird & Co. Incorporated, Research Division, TD Cowen, Research Division, Barclays Bank PLC, Research Division, Wolfe Research, LLC | The most persistent line of questioning from Q1 2025 through Q2 2026, with analysts repeatedly asking for a revenue-at-risk figure that management consistently declined to break out, answering only through the guided range. The pressure has now stopped: there was no federal question at all on the Q3 2026 call, which fits the headwind anniversarying in Q4. |
| Discretionary spend and what would unlock a budget recovery | 13 | BofA Securities, Research Division, Goldman Sachs Group, Inc., Research Division, Wolfe Research, LLC, Deutsche Bank AG, Research Division, Morgan Stanley, Research Division, JPMorgan Chase & Co, Research Division, Citigroup Inc., Research Division | Asked in essentially every call in the window, usually as a search for a catalyst. Management's answer moved from pointing at the January-February budget cycle, to stating there is no visible catalyst, to declining the premise outright in Q1 2026. |
| Whether AI deflates Accenture's own revenue | 7 | Mizuho Securities USA LLC, Research Division, BMO Capital Markets Equity Research, BofA Securities, Research Division, JPMorgan Chase & Co, Research Division, TD Cowen, Research Division, Guggenheim Securities, LLC, Research Division | The most conceptually pointed thread: whether clients capture the AI productivity gain, whether project timelines compress, and whether rate cards fall. Management has answered consistently — AI is expansionary, savings get reinvested, fixed-price contracts already assume technology-driven productivity — without ever quantifying the pass-through. |
| Acquisition pace, valuations and inorganic contribution | 10 | JPMorgan Chase & Co, Research Division, BMO Capital Markets Equity Research, Morgan Stanley, Research Division, Robert W. Baird & Co. Incorporated, Research Division, UBS Investment Bank, Research Division, Guggenheim Securities, LLC, Research Division, Goldman Sachs Group, Inc., Research Division | Intensity has tracked the spend: light in FY25 when deal volume fell, heavy in Q2 and Q3 2026 as the plan went from about $3 billion to approximately $9 billion. Park has acknowledged paying higher multiples with lower immediate uplift; the question analysts keep returning to, and that has not been answered directly, is what the product mix does to the long-term margin trajectory. |
| Bookings conversion and the consulting book-to-bill gap | 8 | JPMorgan Chase & Co, Research Division, BMO Capital Markets Equity Research, Morgan Stanley, Research Division, TD Cowen, Research Division, BofA Securities, Research Division, Wells Fargo Securities, LLC, Research Division, Susquehanna Financial Group, LLLP, Research Division | Analysts have repeatedly tried to bridge strong bookings to weaker reported growth, including a request for the ACV-to-TCV relationship that management declined. The sharpest version came in Q3 2026, when Wells Fargo pointed out the disconnect holds on a trailing twelve-month basis, not just in the quarter. |
| Headcount, revenue per person and the talent rotation | 11 | BofA Securities, Research Division, TD Cowen, Research Division, Wolfe Research, LLC, JPMorgan Chase & Co, Research Division, Goldman Sachs Group, Inc., Research Division, Wells Fargo Securities, LLC, Research Division | A steady thread through the business optimization program and the shift to hiring for new skills. Management's standing answer is that revenue and headcount decoupled with the arrival of RPA around 2015, which sidesteps rather than addresses the question of how much of the recent gap is AI-driven. |
| Middle East impact and the width of the Q4 range | 4 | Citigroup Inc., Research Division, JPMorgan Chase & Co, Research Division, Wells Fargo Securities, LLC, Research Division, Morgan Stanley, Research Division | Concentrated entirely in the latest call and the dominant subject of it. Four of the eight analysts who asked questions came at the Q4 range from a different angle; management confirmed the low end implies continued deterioration but did not name what it would do in that case. |
Language shifts
Only language evidence verified against the referenced component is shown.
| Observation | Verbatim evidence | Call ID | Component |
|---|---|---|---|
| Guidance framing turned conditional in Q3 2026. One quarter after telling investors the company always calls it like it sees it while raising key elements of the full-year guide, the outlook was introduced by flagging that more of the range is now live. | “Given the macro uncertainty, we expect more of the guided range to be in play for Q4.” | 1990916397 | 5 |
| The most direct statement in the window that client budgets are not expanding. Earlier calls described spending as more of the same or unchanged; here it is stated as a constraint that AI has not lifted, and used as the justification for buying into new addressable markets. | “the budgets haven't been even with AI, they're spending it differently, but they haven't been increasing” | 1990916397 | 31 |
| Discretionary weakness was reclassified from a cycle to a structural feature of the industry, with the mid-market presented as the offset rather than a recovery in client budgets. | “the industry has had this challenge now for a few years on discretionary spend, which is really smaller deals” | 1990916397 | 28 |
| For contrast, the FY24 close framed the same weakness as a waiting position — positioning now, upside when the market turns. That conditional optimism has not appeared in the FY26 calls. | “When market conditions improve, we will be well positioned to capitalize them.” | 1885277147 | 2 |
| Sweet declined the premise of the discretionary-recovery question outright in Q1 2026, a sharper register than the earlier practice of deferring to the January-February budget cycle. | “I'm not waiting around for it to come back” | 1962181978 | 25 |
| The advanced AI bookings and revenue series was retired with explicit notice, removing the disclosure that had been the industry's clearest external read on AI monetization since FY23. | “This will be the last quarter in which we share these specific metrics.” | 1962181978 | 2 |
| New hedged-optimism vocabulary appears in the latest call. Large enterprise AI programs are described as early and promising rather than as a demand driver already in the numbers. | “Finally, clients with more advanced digital cores are starting to take on larger AI programs, exciting green shoots.” | 1990916397 | 4 |
Twelve calls show a company responding to a services market that has not improved by widening the market it addresses — OT security software, the mid-market, non-FTE and platform revenue — rather than waiting for discretionary spend to return. The execution record on guidance is good: FY25 was delivered above the original range and each FY25 commitment in this ledger was met. What the history does not yet show is that widening translating into faster growth, and the retirement of the advanced AI disclosure makes that harder to verify from outside. The FY27 debate is whether roughly two points of inorganic contribution and a returning federal business are enough to lift the growth rate, or whether they mostly replace the drags they are offsetting.